This report analyzes business risk exposures present in the S&P 500 over the previous 25 years using Syntax’s Functional Information System (FIS). Unlike traditional industry classification systems, which offer a one-dimensional, static, taxonomical approach to classification, FIS utilizes a multi-dimensional attribute classification system to better understand underlying risk exposures in investment portfolios. Classifying companies using multiple attributes enables analysis that is more precise, more versatile, and better suited to help investors understand the underlying business risks inherent in their investments.
Business Risk is Multi-Dimensional
Fundamentally, companies may be similar to one another in a number of ways – they may produce the same type of product, sell to the same customer base, rely on the same input, be subject to the same regulation, and more. One-dimensional taxonomies like the Global Industry Classification Standard (GICS) are limited to a single notion of similarity, and therefore ignore many notions of similarity. These quantifiable company attributes can be critical for understanding company similarities and related business risk exposures in a portfolio.
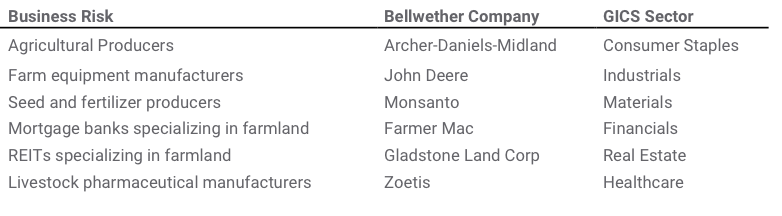
For example, we may be interested in seeing all companies with exposure to the agriculture industry. This includes companies across a wide range of sectors as shown in the table below.
Table 1: Agriculture Business Risk Exposure Types
Oftentimes, these companies share GICS sub-industries with companies that have no agricultural exposure. To properly understand the agricultural risk in a portfolio – and therefore the portfolio’s sensitivity to, say, shocks to agricultural commodities, changes to farm legislation, or the development of new agricultural technologies – we must have a more precise system for identifying business risks.
FIS has been designed to precisely identify business risks. FIS codifies the DNA of businesses and assigns each company its own barcode based on its real economic characteristics: what it produces, to whom it sells, and how its product is used in the larger economic system, among other factors. Each functional marker in an FIS Barcode indicates an area of business risk. These barcodes offer a standardized and multi-dimensional system to capture the business risk attributes that drive a given company's performance.
Multi-Dimensional Business Risk Analysis of the S&P 500
This report uses FIS to analyze six key areas where the business risk exposures in the S&P 500 have evolved substantially in the previous quarter century:
Technology
Advertising-based revenue models
Energy commodities
Financial products
Real Estate
Healthcare
These case studies demonstrate the periodic concentration of the S&P 500 to specific business risks, largely due to the cap-weighting methodology of the S&P 500. By better understanding these exposures, investors are better positioned to protect themselves against market shocks.
Technology Business Risk Exposure
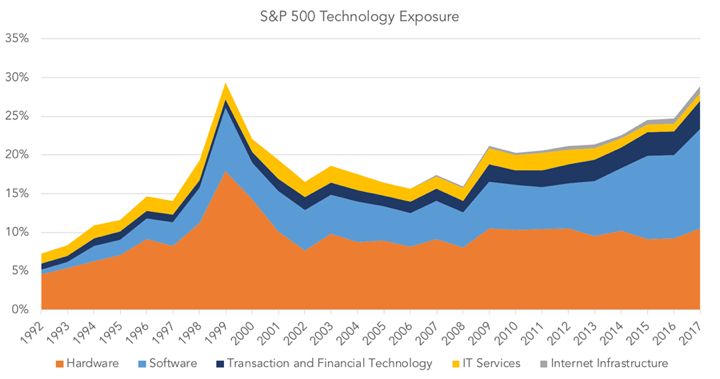
The S&P 500 has significant exposure to technology companies, including those involved in the manufacture of software, hardware, or components as well as the provision of IT services and internet infrastructure services, such as co-location, data centers, and cell tower lessors. This definition differs from the GICS Information Technology sector in that GICS excludes online retail, online streaming, robotics, and other types of businesses with clear technological exposure.
This chart shows two periods of exposure over 25%. The first was the IT bubble in 1999, which was driven mostly by hardware companies. The second is the latest period of 2017, which is driven by software companies, including the FAANG stocks. As of May 2018, total exposure to technology is over 30%.
Advertising-based Revenue Models
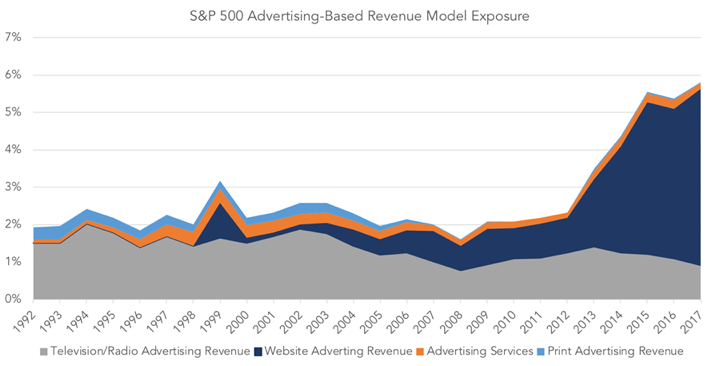
In the past five years, exposure to website-based advertising revenues (including companies like Facebook, Google, and TripAdvisor) has risen dramatically. While only 5% of the overall index has advertising-based revenue exposure, this concentration could be important as the relatively new industry continues to evolve. At the same time, exposure to print-based advertising revenues has fallen to virtually zero, while television and radio advertisements have slowly fallen. While this trend is not surprising, it is an important theme to consider from a valuation and diversification perspective.
Retail: Brick & Mortar versus E-commerce Exposure
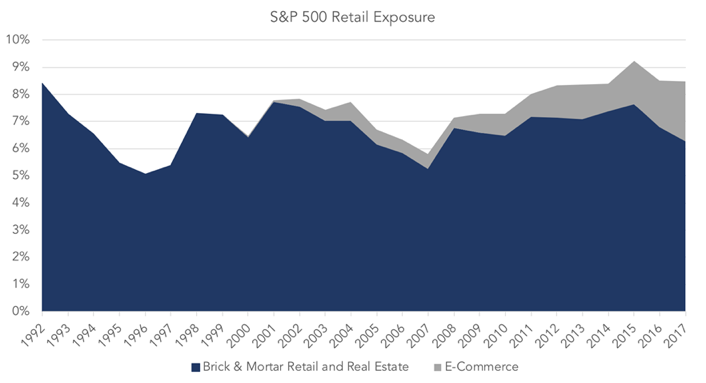
The dip in exposure to brick & mortar retail has been dramatic in the past couple years, but not unprecedented. From a functional viewpoint, brick & mortar retail comprises companies from a diverse set of sectors, including grocery stores and hypermarkets, apparel retailers, pharmacies, and other companies that primarily distribute products through physical stores, as well as retail REITs, so as to provide a more comprehensive measure of brick & mortar retail exposure. The recent growth of E-Commerce provides a well-known challenge to brick & mortar retailers, yet the S&P 500’s exposure to retail is still dominated by traditional brick & mortar businesses.
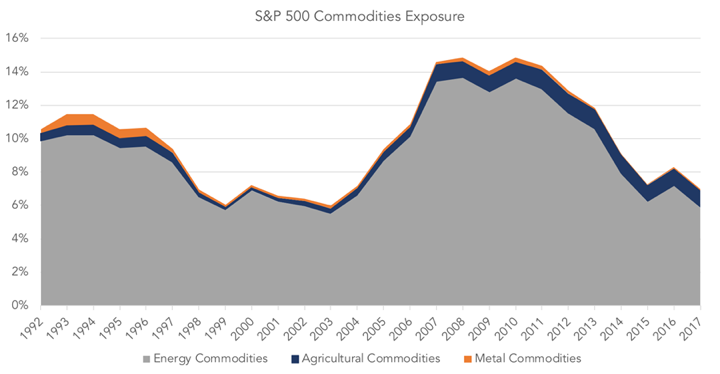
Energy Commodities
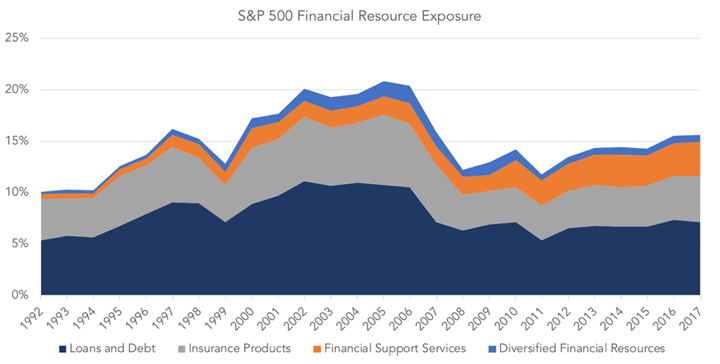
Commodity exposure in the S&P 500 has been historically turbulent, particularly with respect to energy commodities. Exposure to energy commodities tends to fluctuate in line with oil price movements. This can be problematic, as exposure to energy commodities tends to be highest right before a price correction. Market capitalization-weighting leads to an inconsistent commodity exposure over time and investors should review their exposure to the sector on a frequent basis. Meanwhile, exposure to other commodities is and has been minimal. Financial Products Exposure
Prior to the 2008 Financial Crisis, the S&P 500 had a large exposure to companies involved in financial resources. While exposure to all types of financial resources fell during the crash, by far the largest correction during the crisis came in insurance, which reduced in weight to 3.24% from a peak of 6.85% at year-end 2006. Also noteworthy is the current growth of Financial Support Services, which include asset managers, custodian banks, and financial databases, among others.
Real Estate Exposure
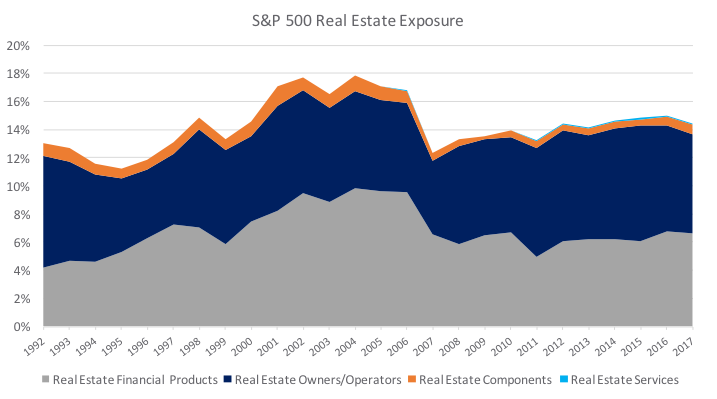
The S&P 500’s Real Estate exposure includes real estate owners and operators, banks with mortgage-heavy loan portfolios, manufacturers of real estate components, and real estate service firms. The weight toward this business risk fell precipitously as the Financial Crisis unfolded, driven largely by the real estate financial products category. Surprisingly, exposure to real estate owners and operators remained relatively stable through the market crash, while manufacturers of real estate components saw a slight dip in exposure. Exposure to financial products backed by real estate, while not near levels seen prior to the financial crises, has increased in recent years. Total Real Estate exposure at the end of 2017 was 14.4% of the S&P 500. Within the Real Estate Owners and Operators category, recent growth has been dominated by REITs, which have far outpaced the growth of real estate operators and developers. REITs first entered the S&P 500 in 2001, and currently all are in the Real Estate Lessors group. It is also interesting to note the fairly limited exposure to real etate developers both before and after the financial crisis. Healthcare Exposure
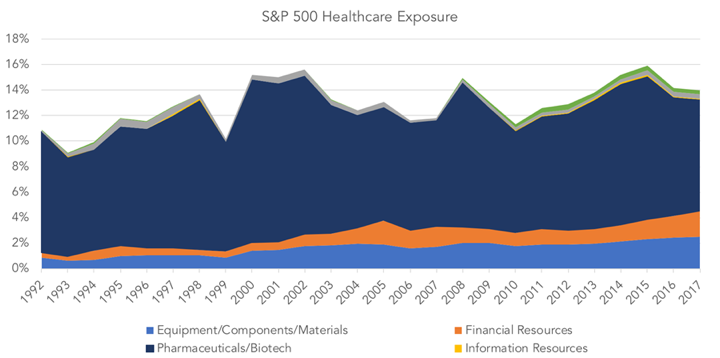
Healthcare exposure in the S&P 500 has been relatively volatile, driven mostly by exposure to pharmaceutical companies, by far the largest exposure within the Healthcare category. From a functional perspective, we measure all companies whose products are used in Healthcare, including pharmaceutical and biotech manufacturers as well as producers of equipment and components used in healthcare, health insurance, direct healthcare services, companies processing healthcare billing and records, and real estate companies specializing in healthcare facilities. The relative share of pharmaceuticals and biotech as a component of healthcare exposure has fallen over time, from 87% in 1992 to 62% today. Given that healthcare spending accounts for almost 18% of US GDP, it appears relatively underweight in the S&P 500.