Since the first COVID-19 vaccines were announced, equity markets have rotated away from technology stocks into the rest of the market, as such diversified methodologies have outperformed (Exhibit 1).
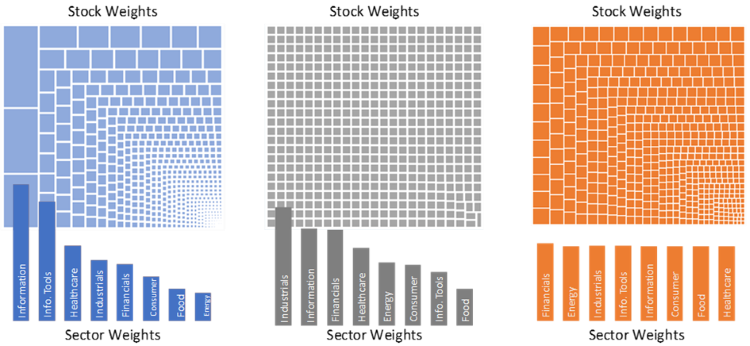
Today, cap-weighted indices like the S&P 500 are more biased and concentrated towards mega cap technology stocks than they were in March 2000. Unlike the DotCom bubble, the risk this time may not be a tech collapse, but that the rest of the market is undervalued and underrepresented in investors’ portfolios. Stratified Weight indices are designed to allocate more equally to sectors and industries to better capture the broad equity risk premium (Exhibit 2).
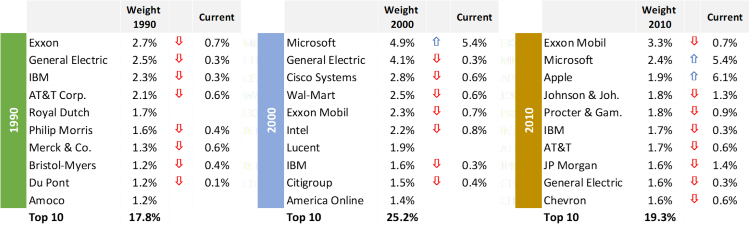
Exhibit 1. Index performance since Pfizer Vaccine Announcement Source: S&P Dow Jones Indices, Syntax. Performance does not reflect fees or implementation costs. Exhibit 2. Better Beta: The Difference is Weighting Example stock and sector weights for the S&P 500, S&P 500 Equal Weight, and Stratified LargeCap Indices.The largest companies have underperformed over the long-run It’s easy to believe that the largest companies today will remain at the top of the index indefinitely, but history is littered with top 10 companies whose current weights are a fraction of what they once were (Exhibit 3).
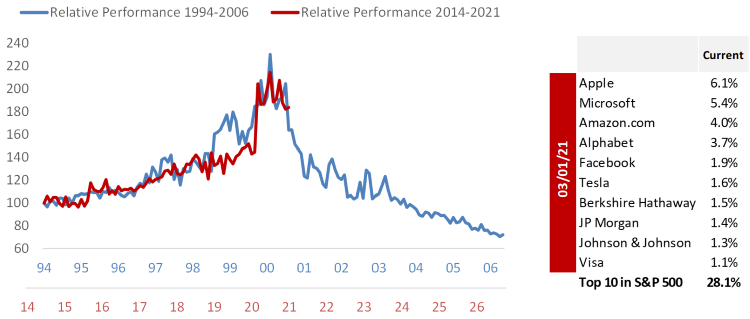
Exhibit 3. The S&P 500's top 10 has changed considerably over the last three decades Source: S&P Dow Jones Indices, Syntax, Legal & General Investment Management America. The ten largest companies in the S&P 500 currently account for 28.1%, a level higher than that seen during the heady days of the dotcom bubble (26.6% in March 2000). Anecdotally, the recent run-up in the 10 largest stocks matches the performance seen of the top 10 during the tech bubble. In the five years following the largest stocks underperformed by 63.8% (Exhibit 4).
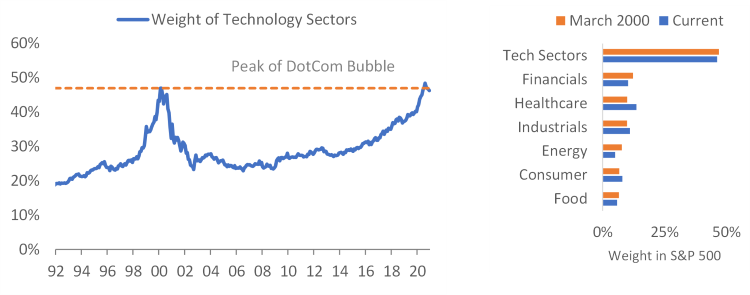
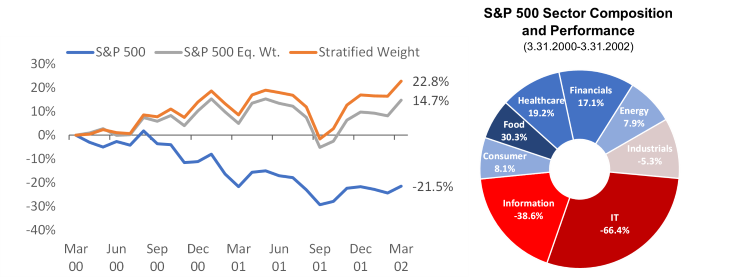
Exhibit 4. Performance of S&P 500 top 10 relative to S&P 500 Equal Weight Index Source: Syntax, S&P Dow Jones Indices. Performance does not reflect fees or implementation costs as an investor cannot directly invest in an index. Sector weightings can cause a drag on the entire index In cap-weighted strategies, risks are further compounded because the largest stocks share technology related business risks and therefore may correlate together on the downside. The weight of the Information and IT sectors combined is 46.2%, roughly the same level that we saw before the tech bubble burst. The other relative sector weights look eerily similar (Exhibit 5).
Exhibit 5. S&P 500 sector composition looks similar to March 2000 Source: Syntax, S&P Dow Jones Indices. When the tech sectors collapsed in March 2000, they dragged the broad index down 21.5%, even though the non-tech sectors rose. An equal or stratified weight strategy would have better captured the broad equity risk premium, rising 14.7% and 22.8% respectively over the next two years (Exhibit 6).
Exhibit 6. Concentrations cause a drag on index performance Source: Syntax, S&P Dow Jones Indices. Total Return, S&P 500, S&P 500 Eq. Weight, and Stratified LargeCap Indices. Performance does not reflect fees or implementation costs as an investor cannot directly invest in an index. Please see important disclaimers regarding backtested data prior to inception.Cap Weight misses attractive opportunities outside Big Tech
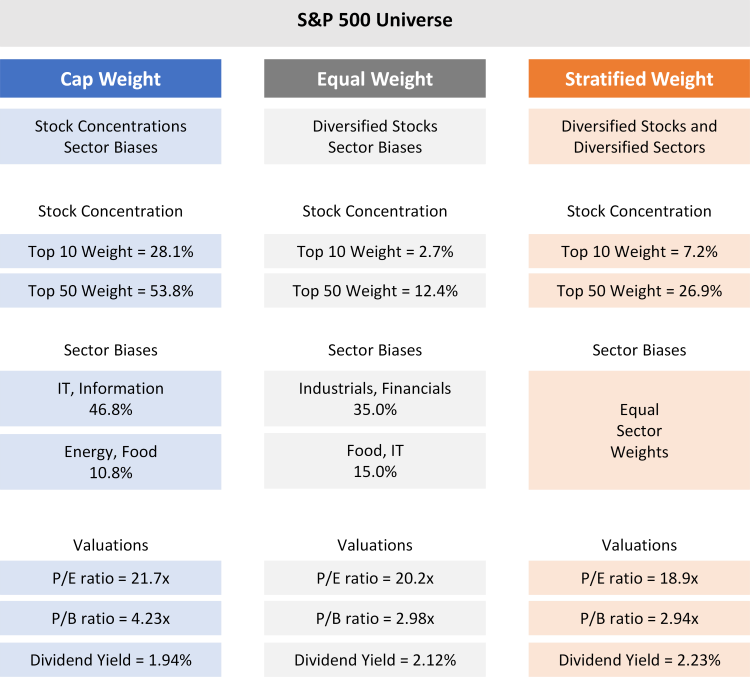
Though valuations of Technology stocks have risen to above their historical averages, they remain well below their bubble multiples and a collapse in tech is therefore less likely than in 2000. However, due to Big Tech’s oversized weight in the S&P 500, more attractively priced “old-economy” sectors like Industrials, Energy, Food and Consumer are under-represented in the index (Exhibit 7).
The Stratified LargeCap invests across the same universe of companies as the S&P 500 index but allocates weight across a broader range of industries and companies. With uncertainty remaining high amidst the new post-COVID paradigm, we believe that diversification matters, now more than ever.
Exhibit 7. Comparison of different weighting methodologies for the S&P 500 universe Source: Bloomberg, Syntax. Data as at 3.2.2021, 12-month forward P/E ratio, 12-month trailing P/B ratio and Dividend Yield shown. Important Disclaimers This document is for informational purposes only and is not intended to be, nor should it be construed or used as an offer to sell, or a solicitation of any offer to buy, any security. Additionally, the information herein is not intended to provide, and should not be relied upon for, legal advice or investment recommendations. You should make an independent investigation of the matters described herein, including consulting your own advisors on the matters discussed herein. In addition, certain information contained in this factsheet has been obtained from published and non-published sources prepared by other parties, which in certain cases have not been updated through the date hereof. While such information is believed to be reliable for the purpose used in this factsheet, such information has not been independently verified by Syntax and Syntax does not assume any responsibility for the accuracy or completeness of such information. Syntax LLC, its affiliates and their independent providers are not liable for any informational errors, incompleteness, or delays, or for any actions taken in reliance on information contained herein.
Past performance is no guarantee of future results. All performance presented prior to the index inception date is back-tested performance. Back-tested performance is not actual performance, but is hypothetical. The inception date of the Syntax Stratified LargeCap Index™ is December 27, 2016. The back-test calculations are based on the same methodology that was in effect when the index was officially launched. However, back-tested data may reflect the application of the index methodology with the benefit of hindsight. Charts and graphs are provided for illustrative purposes only.
Index performance does not represent actual fund or portfolio performance and such performance does not reflect the actual investment experience of any investor. An investor cannot invest directly in an index. In addition, the results actual investors might have achieved would have differed from those shown because of differences in the timing, amounts of their investments, and fees and expenses associated with an investment in a portfolio invested in accordance with an index. None of the Syntax Indices or the benchmark indices portrayed herein charge management fees or incur brokerage expenses, and no such fees or expenses were deducted from the performance shown; provided, however that the returns of any investment portfolio invested in accordance with such indices would be net of such fees and expenses. Additionally, none of such indices lend securities, and no revenues from securities lending were added to the performance shown.
The Syntax Stratified LargeCap Index™ is the property of Syntax LLC, which has contracted with S&P Opco, LLC (a subsidiary of S&P Dow Jones Indices LLC) to calculate and maintain the Index. The Index is not sponsored by S&P Dow Jones Indices or its affiliates or its third-party licensors (collectively, “S&P Dow Jones Indices”). S&P Dow Jones Indices will not be liable for any errors or omissions in calculating the Index. “Calculated by S&P Dow Jones Indices” and the related stylized mark(s) are service marks of S&P Dow Jones Indices and have been licensed for use by Syntax. S&P® is a registered trademark of Standard & Poor's Financial Services LLC (“SPFS"), and Dow Jones® is a registered trademark of Dow Jones Trademark Holdings LLC (“Dow Jones”).
Syntax®, Stratified®, Stratified Indices®, Stratified-Weight™, Stratified Benchmark Indices™, Stratified Sector Indices™, Stratified Thematic Indices™, Affinity™, and Locus® are trademarks or registered trademarks of Syntax, LLC and its affiliate Locus LP.