US exchanges saw a massive boom in new companies last year, particularly in the healthcare and technology industries, along with remarkable growth in SPAC (Special Purpose Acquisition Company) vehicles. This report details the business risk exposures of 2020’s Initial Public Offerings (IPOs) on US exchanges using Syntax’s Affinity™ data and represents the first in a series analyzing the 2020 IPO Market through the Affinity™ lens. Although this report only considers non-SPAC, or traditional, IPOs, a subsequent report on the 2020 SPAC boom will follow.
Unlike traditional industry classification systems, which offer a one-dimensional, static approach to classification, Affinity™ utilizes a multi-dimensional attribute classification system to better understand underlying risk exposures in investment portfolios. Classifying companies using multiple attributes drives analyses that are more precise, more versatile, and better suited to helping investors understand the underlying business risks in the market. This report uses Syntax’s Affinity™ data to understand recent trends in the US IPO market.
Highlights
Tremendous IPO activity in Healthcare
Blockbuster valuations in Technology
Zero IPO activity in Energy
TheSyntax Affinity™ Lens on IPOs In a year plagued by a pandemic, a recession, and high levels of economic uncertainty, the US IPO market also surprised us. Against the odds, the IPO market closed out 2020 with one of the strongest years on record. In fact, including both traditional IPOs and SPACs, there were 565 new company listings in 2020, a level not seen since 1996.[1]
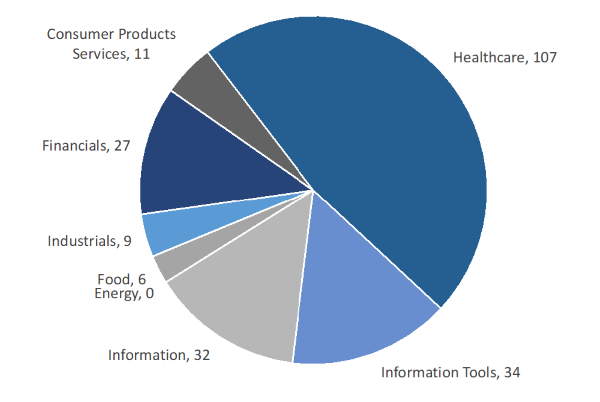
Overall, there were a total of 227 traditional (non-SPAC) US IPOs in 2020. Of these, the largest concentration was in the healthcare sector, with 107 IPOs (47.1%). Behind Healthcare, the sectors most represented were the Information Tools (15.0%) and Information sectors (14.2%). Sector Distribution of 2020 US IPOs by Count Sector allocations based on Affinity™ classification. Source: Syntax, FactSet Research Systems. Overall, the larger concentrations of IPOs in the Healthcare, Information Tools, and Information sectors represent a heavy inflow into the areas of the economy that have seen strong performance over the past few years. Although the precise cause of this fluctuation of investment remains ambiguous, a potential cause could be their relative outperformance to their peer industries. In the Information sector, strong recent performance has contributed to a massive influx of capital, hyperbolic valuations, and a frenzy of IPO activity. By contrast, the healthcare industry - with its patent protections and the increasing cost of healthcare – entices investors with lucrative returns.
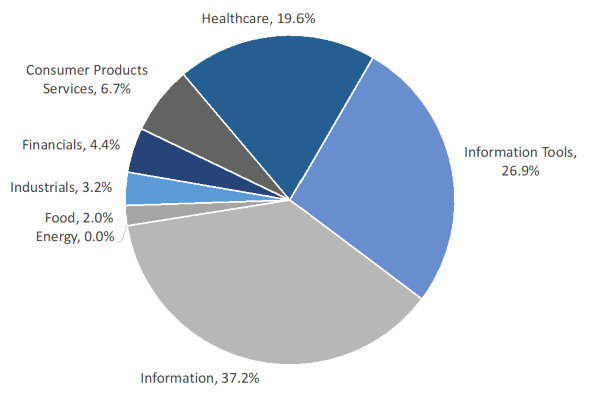
However, the number of IPOs alone does not tell the full story. By size the 2020 IPOs were dominated by blockbuster technology deals and healthcare companies only made up 19.6% of the value.
Sector Distribution of 2020 US IPOs by Market Capitalization Sector allocations based on Affinity™ classification. Source: Syntax, FactSet Research Systems. IPO Market Caps Remarkably Higher in 2020
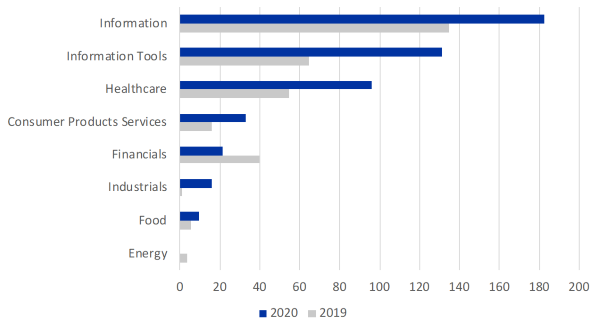
Similar to the rise in sheer volume of IPOs, 2020 saw a boom in IPO market caps. In comparison to 2019, the 2020 US IPO market saw an increase in every sector except Financials and Energy. Overall aggregate market capitalization of IPOs, including SPACs, nearly doubled, expanding from $350.9B in 2019 to $636.2B in 2020. Even excluding SPACs, the size of the IPO market increased by 52.3% in 2020. Using the Affinity™ sector lens to disaggregate, Information Tools saw the largest increase, rising from $64.4B in 2019 to $131.5B in 2020.
However, despite strong growth in most sectors, Energy posted zero IPOs in the year. Its conspicuous absence may be a result of the year’s curtailed energy demand and plummeting oil prices. With oil prices now near their pre-pandemic levels, perhaps 2021 will see rising interest in new Energy listings.
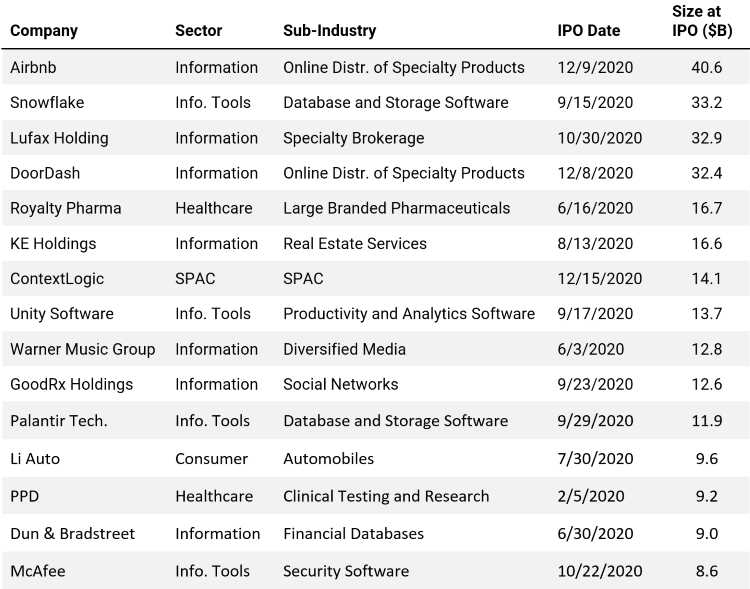
Sector Distribution of 2019/2020 US IPOs by Market Capitalization Sector allocations based on Affinity™ classification. Source: Syntax, FactSet Research Systems. Sector Distribution of 2019/2020 US IPOs by CountSector allocations based on Affinity™ classification. Source: Syntax, FactSet Research Systems. Technology Dominates in Largest IPOs Large, well-hyped technology companies made a killing in 2020. The largest US IPO this year ($40.6B) was Airbnb, the popular room-sharing technology company which went public in December. Similarly, other well-known brands such as DoorDash, an online food delivery platform, made their debut on the public markets with a sizeable valuation of $32.4B. As shown in the chart below, Information, and Information Tools dominated the list of the largest fifteen public offerings by market cap.
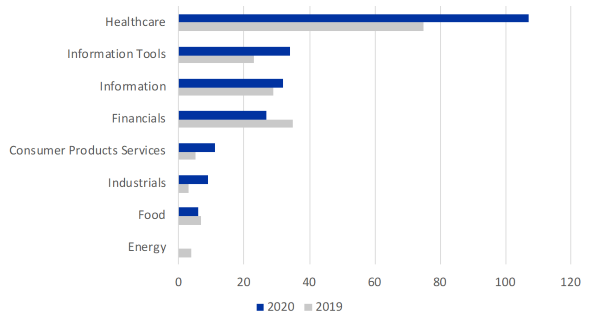
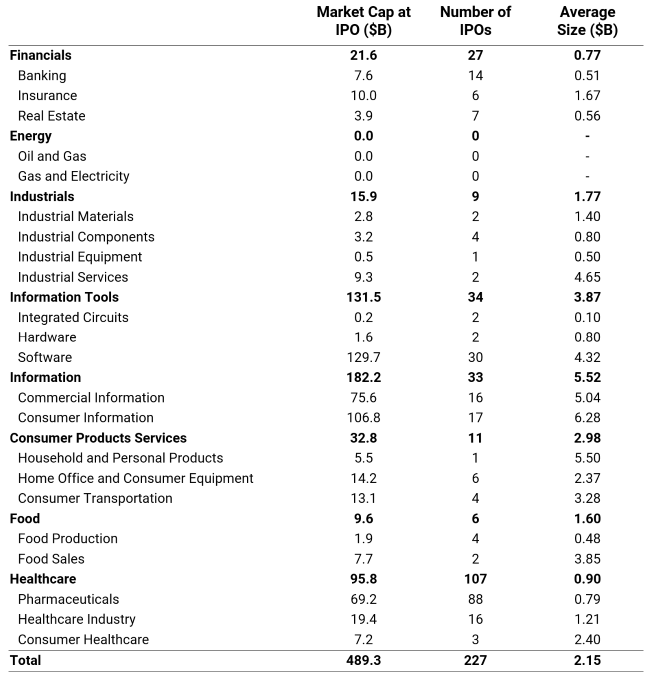
Company assignments based on Affinity™ classification. Size at IPO is the sum of market capitalization of each IPO at their respective IPO dates. Source: Syntax, FactSet Research Systems.2020 US IPOs by Sector Company assignments based on Affinity™ classification. Market Cap at IPO is the sum of market capitalization of each IPO at their respective IPO dates. Average Size the sum of market capitalization of each IPO at their respective IPO dates divided by the total number of IPOs. Source: Syntax, FactSet Research Systems. Swollen Growth in 2020 Healthcare In a year rocked by the COVID-19 pandemic, it seems fitting that the Healthcare sector comprised the bulk of IPOs. Of the 227 traditional IPOs, the Healthcare sector represented 47.1%, making it the largest sector by a hefty margin. Nevertheless, while Healthcare had the highest number of IPOs in 2020, it only accounted for 19.6% by market cap.
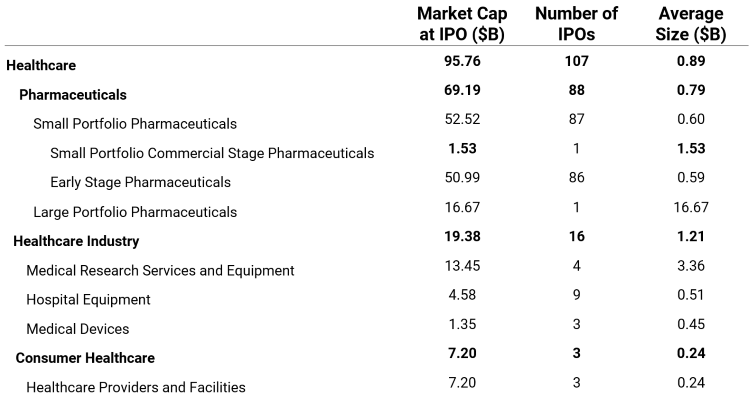
Within healthcare, the vast majority of public offerings were in branded pharmaceuticals (88), of which all but one were small, pre-revenue drug companies. The notable exception within the category was the large branded pharmaceutical company, Royalty Pharma.[2] In contrast, other industries in this sector were sparsely represented. Company assignments based on Affinity™ classification. Market Cap at IPO is the sum of market capitalization of each IPO at their respective IPO dates. Source: Syntax, FactSet Research Systems. While the number of additions was heaviest in branded pharmaceuticals by a large margin, it should be noted that on average, they were much smaller in market cap. Conversely, the few IPOs in the Healthcare Industry group – which includes companies providing products and services to healthcare providers – were significantly larger. By concentrating capital in early-stage, more precarious drug companies over more established Healthcare Industry businesses, the Healthcare sector’s recent additions are skewed riskier. This pattern is mirrors trends in 2019, where branded pharmaceuticals represented roughly $25B in market cap and 56 companies, largely comprised of early-stage pharmaceutical companies. However, Healthcare Industry made up a larger share of all Healthcare IPOs in 2019, at roughly $29B in market cap across 16 companies.
When the world shut down, Information went viral After a socially distanced year, it is unsurprising that 2020 witnessed a surge in online platform usage. Driven by this trend, the year brought substantial IPO activity in both the Information and Information Tools Sectors. Over 2020, the Information sector represented 14.5% (33) of total IPOs in the US, while simultaneously representing $182.2B of IPO value (37.3% of all 2020 non-SPAC market cap), making it the sector with the heaviest concentration of investments. Notably, new listings in Information were a whopping 36.7% larger by market cap than the next biggest sector, Information Tools at 26.9%. From a top, sector level analysis, Information sector industries like commercial information (16) and consumer information (17) appear roughly equal in count; however the concentration of capital in their respective sub industries was fairly skewed, with Internet Services and Websites dominating in Consumer Information (85.1%) and Transactions Brokerage dominating in Commercial Information (79.8%). In the Information Tools sector, the Software (30) category made up the lion’s share of market cap (98.7%). Overall, these two sectors absorbed a lopsided concentration of new capital that skewed toward key sub industries.
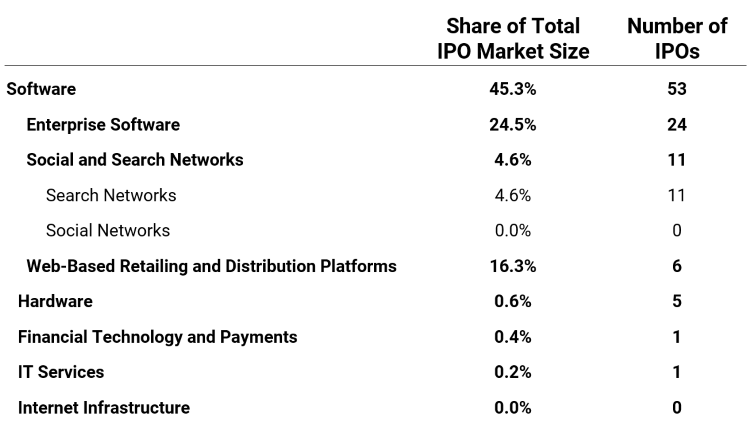
Although sector hierarchies offer a compelling lens into IPOs, this hierarchical approach struggles to show how IPO activity trends cut across sectors. In 2020, this is particularly noticeable with respect to Technology themes, which can be found in a range of sectors, including Information, Information Tools, Financials, and Industrials. Company assignments based on Affinity™ classification. Certain categories for which there were zero 2020 IPOs are omitted. These categories are: Automation, Robotics, and Industrial Hardware; Electronic Components; Computers, Phones, and Consumer Electronics; Electronic Systems for Transportation; Network Equipment & Servers; and Commercial Hardware. Share of Total IPO Market Size is calculated as each constituent’s market capitalization at IPO divided by the sum of market capitalization of each IPO at their respective IPOs. Source: Syntax, FactSet Research Systems.
Companies associated with Technology accounted for 46.52% of the 2020 US IPO Market Cap. Within the Thematic, software companies stole the show, upholding their status as the darlings of the tech industry. In particular, Enterprise Software companies accounted for the majority of the 53 IPOs in Technology and 24.5% of the overall traditional IPO market. Companies like Snowflake Inc, Unity Software Inc, Palantir Technologies, McAfee Corp, and ZoomInfo Technologies dominated the Enterprise Software category.
While Enterprise Software companies accounted for a large share of the overall market, the market cap weight per company was relatively tame compared to the explosion in Web-Based Retailing and Distribution Platforms. Perhaps it is unsurprising that during a global pandemic, these companies, which use software platforms to distribute a range of consumer goods and services, saw some of the largest, most heavily anticipated IPOs of 2020. Despite only having 6 IPOs, Web-Based Retailing and Distribution Platforms accounted for 16.3% of the overall total IPO market cap in 2020, led by Airbnb and DoorDash, which collectively accounted for 90.2% of the market cap in Web-Based Retailing and Distribution Platforms.
2020 also saw a pocket of activity in the Search Networks, companies that provide online platforms and tools to find data, including online databases and listing platforms. With much of the world online during 2020, Search Networks presented an ideal environment for IPOs. Together, the 11 companies that listed in 2020 accounted for 4.6% of the overall market cap. Companies like GoodRX Holding and American Well Corp. led the category.
Lights out for energy in 2020 Conspicuously absent from 2020 IPOs were Energy companies. This absence, in large part, may be attributed to the global pandemic and consequent halt to the global economy and travel substantially curtailed the consumption of oil, gas, electricity, and other energy sources. This drop reverberated in the IPO market: despite strong anticipation for green energy IPOs at the start of the year, such speculation was not borne out throughout the arduous months of the pandemic. Another possible explanation, offered by some financial experts[3], hypothesizes that traditional IPOs in the energy sector may have found their way to the public market in an unorthodox way: using SPACs to go public without the stringency of the IPO process. Between a lack of travel, negative energy prices, SPAC substitutions, and speculative fear of regulation due to a shifting presidential administration, the Energy sector faced significant headwinds in 2020. This will be an interesting part of the economy to keep an eye on for 2021.
Takeaways
IPOs continue to be incredibly active overall, with record highs by both number and size in 2020.
Individual IPOs also saw blockbuster valuations in new listings, especially in large software platforms.
Healthcare IPOs continued 2019 trends of large numbers of listings of early-stage companies with lots of capital associated.
There was a high concentration of new capital in Information, Information Tools, and Software IPOs.
Limited IPO activity in the Energy, Financial, Food, Consumer, Industrial sectors, likely heavily influenced by COVID-19.
[1] Ritter, Jay R. “Initial Public Offerings: Updated Statistics.” Warrington College of Business, 2021 University of Florida, 10 Mar. 2021, site.warrington.ufl.edu/ritter/files/IPO-Statistics.pdf. [2] Full disclosure: Rory Riggs, the CEO of Syntax, LLC, is a cofounder of Royalty Pharma and is currently a member of its board of directors. [3] Elliott, Rebecca. “Investors Turn to SPACs for Clean-Energy Bets.” Wall Street Journal, 11 Dec. 2020, www.wsj.com/articles/investors-turn-to-spacs-for-clean-energy-bets-11607702418.
Disclaimers This document is for informational purposes only and is not intended to be, nor should it be construed or used as an offer to sell, or a solicitation of any offer to buy, any security. Additionally, the information herein is not intended to provide, and should not be relied upon for, legal advice or investment recommendations. You should make an independent investigation of the matters described herein, including consulting your own advisors on the matters discussed herein. In addition, certain information contained in this factsheet has been obtained from published and non-published sources prepared by other parties, which in certain cases have not been updated through the date hereof. While such information is believed to be reliable for the purpose used in this document, such information has not been independently verified by Syntax and Syntax does not assume any responsibility for the accuracy or completeness of such information. Syntax LLC, its affiliates and their independent providers are not liable for any informational errors, incompleteness, or delays, or for any actions taken in reliance on information contained herein. Charts and graphs are provided for illustrative purposes only.
Syntax® and Affinity™ are trademarks or registered trademarks of Syntax, LLC and its affiliate Locus LP.