Small Caps resurgence shows no signs of slowing down
Affinity Themes: Investing in the commodities rebound
Stratified Indices continue strong performance in Q1 2021
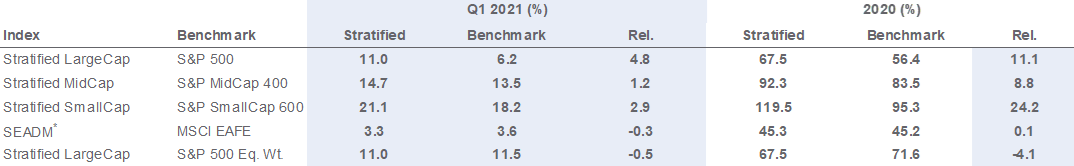
The continued success of the mass vaccination program has seen US equities hit new highs in Q1. Year-over-year, the S&P 500 is up 56.4%, with the mid cap and small cap benchmarks exhibiting even stronger performance (up 83.5% and 95.3% respectively). The recovery was driven by a reversal in the hardest hit sectors and hence high momentum stocks and cap-weighted indices underperformed their alternatively weighted counterparts.
The Stratified LargeCap Index, which weights companies to capture value in a broad range of industries, returned 67.5% over the past year, significantly outperforming the S&P 500, up 56.4% (Exhibit 1). Smaller cap companies also fared well as investors became more risk seeking; the Stratified MidCap Index outperformed the S&P MidCap 400 by 8.8% (92.3% vs 83.5%) and the Stratified SmallCap Index outperformed the S&P SmallCap 600 by 24.2% (119.5% vs 95.3%). As we wrote in our recent report, “Recoveries, Rotations and Business Risk”, this value resurgence is in its early stages and we believe the performance of alternative weight has room to run.
Exhibit 1. Core Index Comparison: Stratified, Cap, and Equal Weight Source: Syntax, S&P Dow Jones Indices, MSCI. Total return performance does not reflect fees or implementation costs as an investor cannot directly invest in an index. 12-months covers period from 3.31.2020 to 3.31.2021. * Syntax Stratified Europe & Asia Developed Markets Index, based on the MSCI EAFE universe.
Stratified Weight adds value in every sector
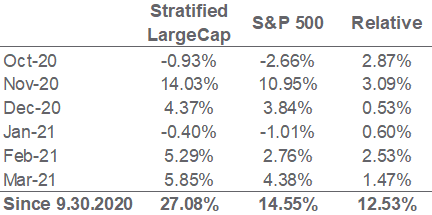
Most US LargeCap benchmarks remain overexposed to mega-cap technology stocks and underexposed to value sectors (e.g. Industrials), which created a drag as the “reopening rotation” that saw value outperform tech took hold in Q4 2020. Stratified Weight allocates equitably across business risks and as such, the Stratified LargeCap Index was able to fully capitalize on the reversal, outperforming every month since September 2020 (Exhibit 2).
Exhibit 2. Stratified LargeCap Index vs S&P 500 Index, month-by-month Source: Syntax, S&P Dow Jones Indices. Total return performance does not reflect fees or implementation costs as an investor cannot directly invest in an index.
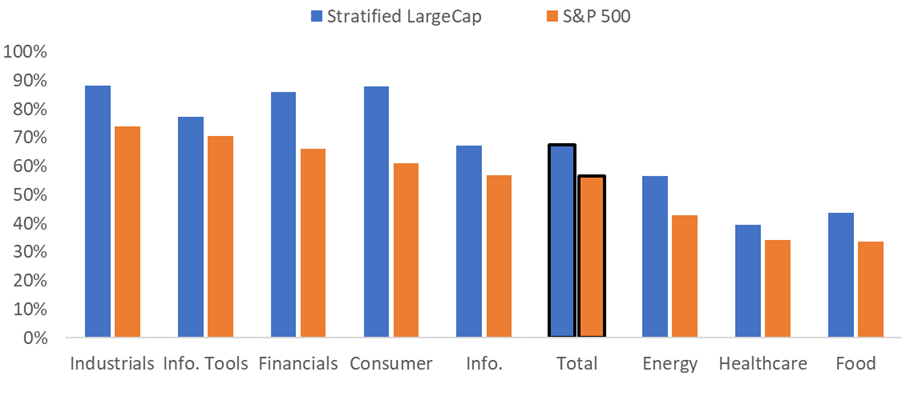
The outperformance of the Stratified LargeCap Index was not just driven by its diversified sector allocation, but also by the reversal of sold-off (value) stocks within each sector. Each Stratified Weighted sector outperformed its cap weighted counterpart over the last year, by 13.4% on average.
Exhibit 3: Stratification added value in every sector over the past 12 months Cumulative total return, Stratified LargeCap Index and S&P 500 Index and sector subsets, 3.31.2020 - 3.31.2021. Performance does not reflect fees or implementation costs as an investor cannot directly invest in an index. Source: S&P Dow Jones Indices, Syntax.
Investors turn to small caps for a higher premium
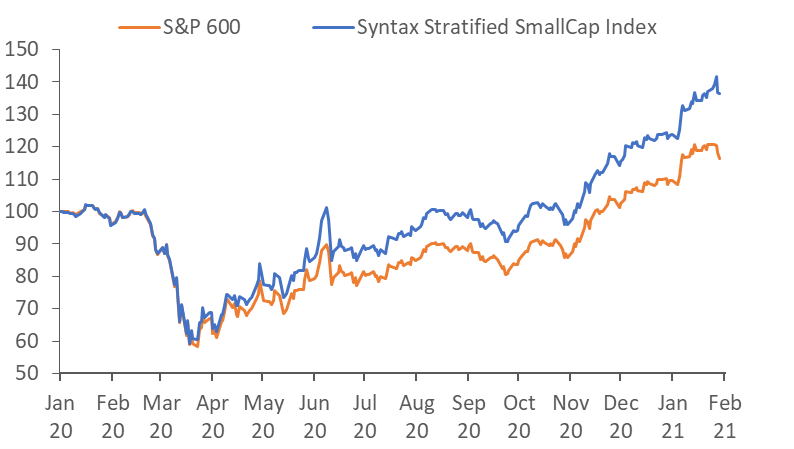
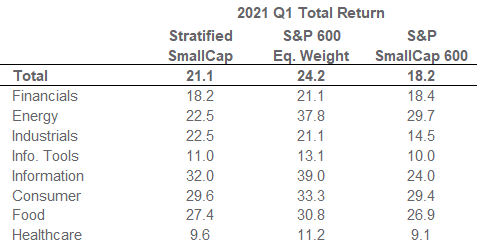
As investors have favored value over growth, so too have they favored small cap over large cap. After strong performance in Q4 2020, the S&P SmallCap 600 Index rose 18.2% in Q1 2021, once again outperforming the S&P 500. The Syntax Stratified SmallCap Index showed even stronger performance than its cap-weighted analog, rising 21.1% over the quarter (Exhibit 1). The strong performance could signal an investor preference for the growth potential of small cap companies, coupled with their reasonable valuations, especially relative to their large cap counterparts.
Stratified Weight is a diversified way to gain exposure to an asset class, such as small caps. By allocating across a wider range of business groups than cap-weighted benchmarks (which typically have concentrated positions in certain stocks and industries), Stratified Weight balances exposure to different types of businesses. This increases the likelihood that the index has material allocation to the best performing segments, while not over-allocating to the worst performing ones. Over the past year, we have seen how this weighting choice has led to outperformance through diversification within the small cap universe.
Investors may gain small cap exposure as part of their core equity allocation by following the Syntax US Total Market Index. The index gives more exposure to smaller companies than the S&P 1500, by using the Stratified Weight approach and imposing a blend of the Stratified LargeCap Index (85%); Stratified MidCap (10%) and Stratified SmallCap (5%) Indices.
Exhibit 4. Performance of SmallCap indices during Pandemic Source: Syntax, S&P Dow Jones Indices. Total return performance does not reflect fees or implementation costs as an investor cannot directly invest in an index. Please see important disclaimers regarding backtested data prior to inception.
Affinity Commodities Theme
Last quarter we highlighted the rise in inflation expectations and how investors can gain a focused exposure by following the Syntax Real Asset Index. In light of the recent performance in commodity prices (crude oil is up 23.1% YTD; copper is up 12.7% YTD), we look at Affinity’s various commodity lenses and show how investors can express their expectations through the equity markets.
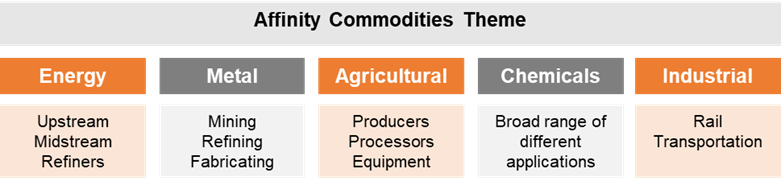
The Affinity Commodities Theme isolates companies that produce or are instrumental in producing commodity products. For example, the Metal Commodities subgroup includes Metal Suppliers, Metal Refiners and Metal Consumers. The Energy Commodities subgroups take a similar approach, covering upstream, midstream and downstream companies. The structure of the Affinity Commodities thematic is shown in Exhibit 5 below.
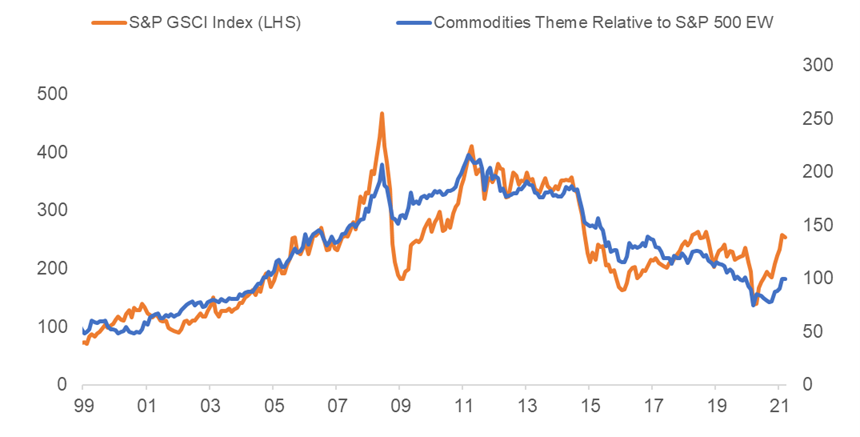
Exhibit 5. Structure of the Affinity Commodities Theme The commodity groups have a significant correlation with their most relevant commodity prices. Exhibit 6 shows the strong correlation (0.62) of the Commodities Theme’s relative performance and the GSCI index.
Exhibit 6. Commodity stocks relative to S&P 500 EW vs GSCI index Source: Syntax, Affinity, S&P Dow Jones Indices. The Affinity Commodities Theme performance is calculated as the weighted average total return of the subset of the S&P 500 Equal Weight Index constituents who are members of the Affinity Commodities Theme. The blue plotted line is the relative performance of the Affinity Commodities Theme to the S&P 500 Equal Weight. Total return performance does not reflect fees or implementation costs as an investor cannot directly invest in an index.
Sector and Composite Performance
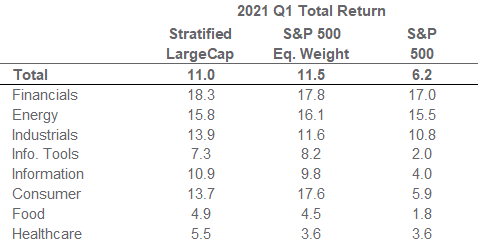
US LargeCap (S&P 500 universe) Source: Syntax. Performance does not reflect fees or implementation costs as an investor cannot directly invest in an index.
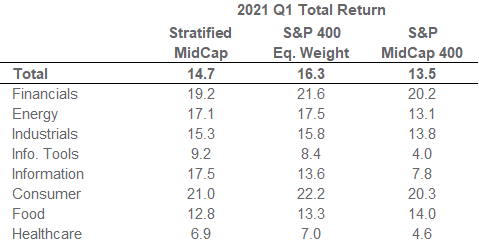
US MidCap (S&P MidCap 400 universe) Source: Syntax. Performance does not reflect fees or implementation costs as an investor cannot directly invest in an index.
US SmallCap (S&P SmallCap 600 universe) Source: Syntax. Performance does not reflect fees or implementation costs as an investor cannot directly invest in an index.
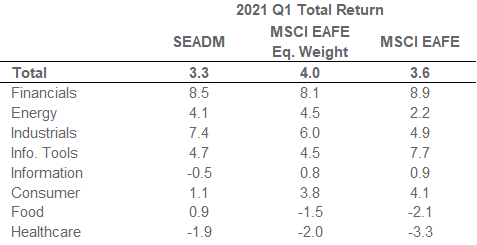
International Developed (MSCI EAFE universe)
Source: Syntax. Performance does not reflect fees or implementation costs as an investor cannot directly invest in an index.
Important Disclaimers
This document is for informational purposes only and is not intended to be, nor should it be construed or used as an offer to sell, or a solicitation of any offer to buy, any security. Additionally, the information herein is not intended to provide, and should not be relied upon for, legal advice or investment recommendations. You should make an independent investigation of the matters described herein, including consulting your own advisors on the matters discussed herein. In addition, certain information contained in this factsheet has been obtained from published and non-published sources prepared by other parties, which in certain cases have not been updated through the date hereof. While such information is believed to be reliable for the purpose used in this factsheet, such information has not been independently verified by Syntax and Syntax does not assume any responsibility for the accuracy or completeness of such information. Syntax LLC, its affiliates and their independent providers are not liable for any informational errors, incompleteness, or delays, or for any actions taken in reliance on information contained herein.
Past performance is no guarantee of future results. The inception date of the Syntax Stratified LargeCap and Syntax Stratified MidCap Indices was December 27, 2016. The inception date of the Syntax Stratified SmallCap Index was January 3, 2020. The inception date of the Syntax Europe & Asia Developed Markets (“SEADM”) Index was January 1, 2016. The inception date of the Syntax Real Asset Index was July 1, 2015. Charts and graphs are provided for illustrative purposes only.
Index performance does not represent actual fund or portfolio performance and such performance does not reflect the actual investment experience of any investor. An investor cannot invest directly in an index. In addition, the results actual investors might have achieved would have differed from those shown because of differences in the timing, amounts of their investments, and fees and expenses associated with an investment in a portfolio invested in accordance with an index. None of the Syntax Indices or the benchmark indices portrayed herein charge management fees or incur brokerage expenses, and no such fees or expenses were deducted from the performance shown; provided, however that the returns of any investment portfolio invested in accordance with such indices would be net of such fees and expenses. Additionally, none of such indices lend securities, and no revenues from securities lending were added to the performance shown.
The Syntax Stratified LargeCap Index, Syntax Stratified MidCap Index, Syntax Stratified SmallCap Index, SEADM Index are the property of Syntax, LLC, which has contracted with S&P Opco, LLC (a subsidiary of S&P Dow Jones Indices LLC) to calculate and maintain the Indices. The Indices are not sponsored by S&P Dow Jones Indices or its affiliates or its third party licensors (collectively, “S&P Dow Jones Indices”). S&P Dow Jones Indices will not be liable for any errors or omissions in calculating the Index. “Calculated by S&P Dow Jones Indices” and the related stylized mark(s) are service marks of S&P Dow Jones Indices and have been licensed for use by Syntax, LLC. S&P® is a registered trademark of Standard & Poor's Financial Services LLC (“SPFS"), and Dow Jones® is a registered trademark of Dow Jones Trademark Holdings LLC (“Dow Jones”). The MSCI EAFE Index was used by Syntax, LLC as the reference universe for selection of the companies included in the SEADM Index. MSCI does not in any way sponsor, support, promote or endorse the Index. MSCI was not and is not involved in any way in the creation, calculation, maintenance or review of the Index. The MSCI EAFE Index was provided on an “as is” basis. MSCI, each of its affiliates and each other person involved in or related to compiling, computing or creating the MSCI EAFE Index (collectively, the “MSCI Parties”) expressly disclaim all warranties (including, without limitation, any warranties of originality, accuracy, completeness, timeliness, non‐infringement, merchantability and fitness for a particular purpose). Without limiting any of the foregoing, in no event shall any of the MSCI Parties have any liability for any direct, indirect, special, incidental, punitive, consequential (including, without limitation, lost profits) or any other damages in connection with the MSCI EAFE Index or the SEADM Index. Prior to March 19, 2018, the SEADM Index was calculate by NYSE. Sector subsets of the Syntax Stratified LargeCap, Syntax Stratified MidCap, and SEADM Indices are calculated using model performance generated in FactSet, and as such may differ from index calculations performed by S&P Dow Jones Indices. The Affinity Commodities Theme is the property of Syntax, LLC, which has calculated its performance using Syntax Affinity™. Syntax will not be liable for any errors or omissions in calculating the Affinity Commodities Theme. Syntax®, Stratified®, Stratified Indices®, Stratified-Weight™, Stratified Benchmark Indices™, Stratified Sector Indices™, Stratified Thematic Indices™, Affinity™, and Locus® are trademarks or registered trademarks of Syntax, LLC and its affiliate Locus LP.
The S&P 500® Index is an unmanaged index considered representative of the US mid- and large-cap stock market. The MSCI EAFE Index is an unmanaged index considered representative of the European, Australian, and East Asian large-cap stock market. Benchmark data for the S&P 500, S&P 500 Equal Weight, S&P MidCap 400, S&P MidCap 400 Equal Weight, S&P SmallCap 600, S&P SmallCap 600 Equal Weight, and S&P Real Assets Equity Indices are provided by S&P Dow Jones through FactSet®. Benchmark data for the MSCI EAFE index is provided by MSCI through FactSet.