VIX and S&P 500 both rise in Q2 and Q3 - suggests more volatility to come
Tech sector sees a renewed focus on valuation
Active Business Risk: Core products are heavily biased
US equities continued to rally in Q3 as economic data and earnings growth remained strong. However, the quarterly performance numbers mask a treacherous environment. As US equity markets rose, so too did the VIX (investors are becoming increasingly nervous). At the same time, both the IPO market and the public equity markets are hinting that valuation matters again and that momentum strategies may see further downside pressure. These themes make us worried about the heavy concentration cap-weighted indices have in high momentum, high valuation technology stocks.
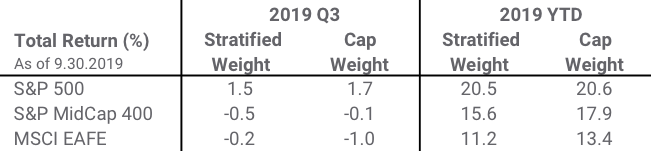
Core Index Comparison: Cap Weight versus Stratified Weight Source: Syntax. Performance does not reflect fees or implementation costs as an investor cannot directly invest in an index.
Record bull market, but volatility on the rise
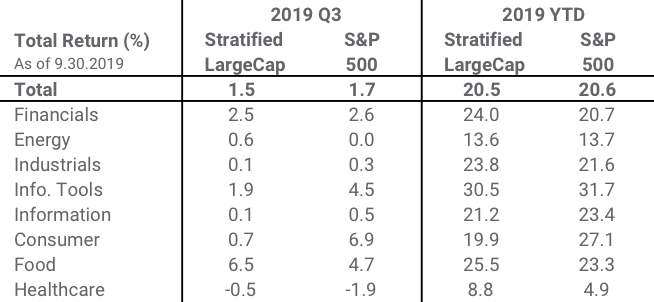
The S&P 500 rose 1.7% and the Stratified LargeCap Index (which comprises the same stocks with different weights) performed in line (+1.5%). While political uncertainty and trade concerns still persist, the S&P 500 is in the longest bull market period in history, according to the Wall Street Journal, and through Q3 2019 the S&P 500 had risen 20.6%, its strongest YTD performance since 1997(1). Despite its more diversified weighting approach, the Stratified LargeCap Index performed in-line with its cap-weighted counterpart.
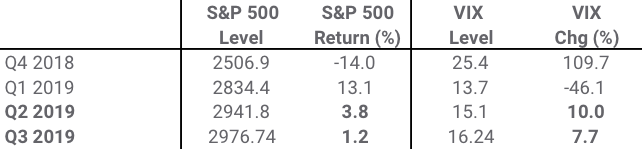
However, the picture is not as rosy under the surface. The US yield curve has inverted deep into its term structure and the IPO market is showing signs of weakness (especially for high valuation companies). Though the S&P 500 rose in Q2 and Q3, the VIX also rose, breaking its usual negative correlation.
Volatility Index and S&P 500: Last four quarters Source: Bloomberg, Syntax. S&P 500 and VIX price level and price return. Performance does not reflect fees or implementation costs as an investor cannot directly invest in an index. This is very unusual - the two indices have a negative 70% correlation and there are only 7 other instances in 25 years of both indices rising in consecutive quarters.
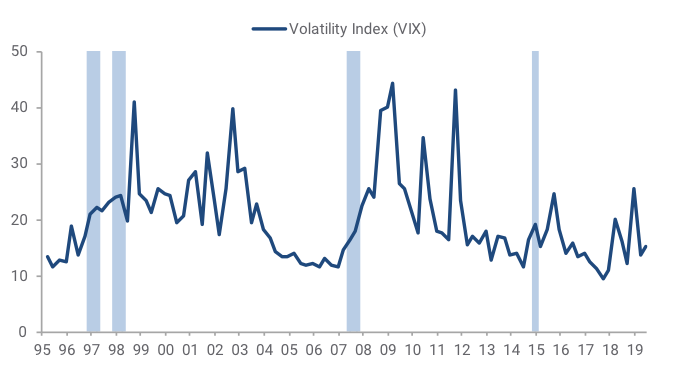
Periods when S&P 500 and VIX both rose in consecutive quartersSource: Bloomberg, Syntax. Shaded regions represent periods with positive increases in both the VIX and S&P 500 Indices for two or more consecutive quarters.
For the seven similar periods, shown as the blue bars on the chart above, the average level of the VIX was 20.7 - similar to its level at the time of writing (20.3 on 10.8.2019). The following year, the VIX rose over 20% on average.
1. See Wall Street Journal, “U.S. Stocks Poised to Enter Longest-Ever Bull Market.” Aug 21 2019
Tech sector sees a renewed focus on valuation
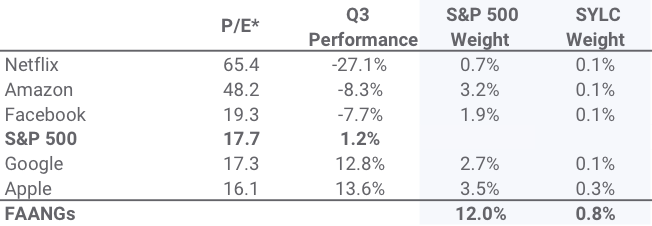
The anti-trust investigations into big tech (see Q2 Insights), coupled with a softening in the IPO market has given investors a renewed focus on valuation for technology related companies. In Q3, the FAANG stocks with above market P/E multiples underperformed the market, whereas those with lower multiples outperformed. Four of the five FAANG stocks are in the Information sector and oversized exposure in many market cap-weighted indices has led to a bias in that sector. In contrast, by spreading weight more evenly, the Stratified LargeCap Index allocated only 0.8% to the FAANG stocks in Q3.
FAANG stocks: Valuation and performance in Q3
Source: Bloomberg. 12m forward P/E ratio on 6.30.2019
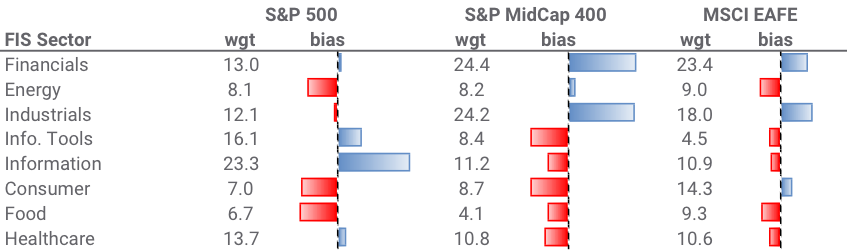
Core equity products remain heavily biased
The Syntax Active Business Risk Score enables us to more accurately measure the amount of sector and industry bias in a portfolio or index. It is a measure of industry weightings relative to a neutral (equal) business risk exposure (see “Active Business Risk” by Rory Riggs).
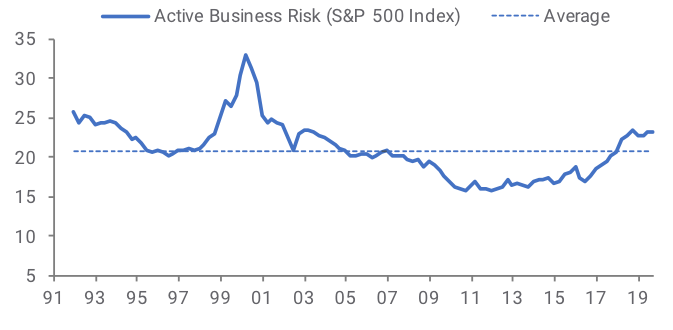
We find that key equity indices continue to take large positions in specific business areas and have above average Active Business Risk scores. For example the S&P 500 has a score consistent with that seen in Q4 1999.
Historically, when markets become over concentrated, economic shocks carry an exaggerated impact on overall performance and hence the portfolio underperforms its potential. We caution taking a cap-weighted approach to capture the equity risk premium at these Active Business Risk levels.
Sector Exposure and Bias (from neutral business risk) Source: Syntax. “Wgt” represent the weight of each sector as of 9.30.2019; “bias” represent deviation from neutral business risk exposure, as defined using Syntax’s FIS classification system; blue bars indicate overexposure to the sector, while red bars indicate underexposure. Active Business Risk in the S&P 500 Source: Syntax. Active Business Risk of the S&P 500 Index from 12.31.1991 to 9.30.2019. Active Business Risk is the average of the sum of the absolute deviation between index weight and neutral business risk exposure for each level in the Syntax business risk taxonomy, as defined using Syntax’s FIS classification system
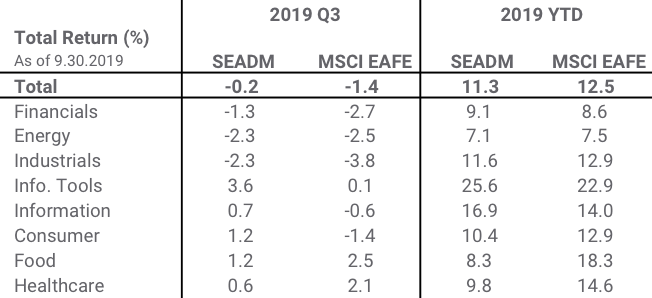
Sector and Composite Performance
US LargeCap (S&P 500 universe) Source: Syntax. Performance does not reflect fees or implementation costs as an investor cannot directly invest in an index. Europe & Asia Developed Markets (MSCI EAFE universe) Source: Syntax. Performance does not reflect fees or implementation costs as an investor cannot directly invest in an index.
Disclaimers
Past performance is no guarantee of future results. Charts and graphs are provided for illustrative purposes only.
The Syntax Stratified LargeCap Index, Syntax Stratified MidCap Index, and Syntax Europe & Asia Developed Markets (“SEADM”) Index are the property of Syntax, LLC, which has contracted with S&P Opco, LLC (a subsidiary of S&P Dow Jones Indices LLC) to calculate and maintain the Indices. The Indices are not sponsored by S&P Dow Jones Indices or its affiliates or its third party licensors (collectively, “S&P Dow Jones Indices”). S&P Dow Jones Indices will not be liable for any errors or omissions in calculating the Index. “Calculated by S&P Dow Jones Indices” and the related stylized mark(s) are service marks of S&P Dow Jones Indices and have been licensed for use by Syntax, LLC. S&P® is a registered trademark of Standard & Poor's Financial Services LLC (“SPFS"), and Dow Jones® is a registered trademark of Dow Jones Trademark Holdings LLC (“Dow Jones”). The MSCI EAFE Index was used by Syntax, LLC as the reference universe for selection of the companies included in the SEADM Index. MSCI does not in any way sponsor, support, promote or endorse the Index. MSCI was not and is not involved in any way in the creation, calculation, maintenance or review of the Index. The MSCI EAFE Index was provided on an “as is” basis. MSCI, each of its affiliates and each other person involved in or related to compiling, computing or creating the MSCI EAFE Index (collectively, the “MSCI Parties”) expressly disclaim all warranties (including, without limitation, any warranties of originality, accuracy, completeness, timeliness, non‐infringement, merchantability and fitness for a particular purpose). Without limiting any of the foregoing, in no event shall any of the MSCI Parties have any liability for any direct, indirect, special, incidental, punitive, consequential (including, without limitation, lost profits) or any other damages in connection with the MSCI EAFE Index or the SEADM Index. Prior to March 19, 2018, the SEADM Index was calculate by NYSE. Sector subsets of the Syntax Stratified LargeCap, Syntax Stratified MidCap, and SEADM Indices are calculated using model performance generated in FactSet, and as such may differ from index calculations performed by S&P Dow Jones Indices. Syntax®, Stratified®, Stratified Indices®, Stratified-Weight™, Stratified Benchmark Indices™, Stratified Sector Indices™, Stratified Thematic Indices™, and Locus® are trademarks or registered trademarks of Syntax, LLC and its affiliate Locus LP. FactSet® is a registered trademark of FactSet Research Systems, Inc.
Index performance does not represent actual fund or portfolio performance and such performance does not reflect the actual investment experience of any investor. An investor cannot invest directly in an index. In addition, the results actual investors might have achieved would have differed from those shown because of differences in the timing, amounts of their investments, and fees and expenses associated with an investment in a portfolio invested in accordance with an index. None of the Syntax Indices or the benchmark indices portrayed herein charge management fees or incur brokerage expenses, and no such fees or expenses were deducted from the performance shown; provided, however that the returns of any investment portfolio invested in accordance with such indices would be net of such fees and expenses. Additionally, none of such indices lend securities, and no revenues from securities lending were added to the performance shown.
The S&P 500® Index is an unmanaged index considered representative of the US mid- and large-cap stock market. The MSCI EAFE Index is an unmanaged index considered representative of the European, Australian, and East Asian large-cap stock market. Benchmark data for the S&P 500 and S&P MidCap 400 Indices are provided by S&P Dow Jones through FactSet®. Benchmark data for the MSCI EAFE index is provided by MSCI through FactSet.
This document is for informational purposes only and is not intended to be, nor should it be construed or used as an offer to sell, or a solicitation of any offer to buy, any security. Additionally, the information herein is not intended to provide, and should not be relied upon for, legal advice or investment recommendations. You should make an independent investigation of the matters described herein, including consulting your own advisors on the matters discussed herein. In addition, certain information contained in this factsheet has been obtained from published and non-published sources prepared by other parties, which in certain cases have not been updated through the date hereof. While such information is believed to be reliable for the purpose used in this factsheet, such information has not been independently verified by Syntax and Syntax does not assume any responsibility for the accuracy or completeness of such information. Syntax LLC, its affiliates and their independent providers are not liable for any informational errors, incompleteness, or delays, or for any actions taken in reliance on information contained herein.
Certain information contained in this presentation is non-public, proprietary and highly confidential and is being submitted to selected recipients only. Accordingly, by accepting and using this factsheet, you will be deemed to agree not to disclose any information contained herein except as may be required by law. This factsheet and the information herein may not be reproduced (in whole or in part), distributed or transmitted to any other person without the prior written consent of Syntax. Distribution of Syntax data and the use of Syntax indices to create financial products requires a license with Syntax and/or its licensors. Investments are not FDIC insured, may lose value and have no bank guarantee.