30 for 30: S&P 500 up over 30% - 4th best annual return in 30 years
Active Business Risk: most concentrated market since June 1999
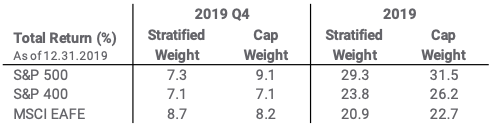
Alternative Weight indices struggle to keep up with Cap Weight
Small Cap resurgence in Q4
Brexit and trade war news eases uncertainty internationally
Sectors: Healthcare and Financials outperform in Q4 after lagging
US Large Cap – 30 for 30
Following a volatile third quarter, equity markets climbed the wall of worry in Q4 (S&P 500 +9.2%). This stands in sharp contrast to the dreadful fourth quarter in 2018 (-13.5%), largely due to a dramatically more dovish Federal Reserve. The S&P 500 celebrated the new year with an annual total return of over 30%, its fourth strongest annual performance in 30 years.
All major indices rose – large, small, value and growth. However, the rally masked the structural bias that prevails in most cap weighted benchmarks, i.e. concentrated exposure to specific business risks. In 2019, concentration in technology propelled the S&P 500 to new highs, as the “big 5” megacap tech stocks (Microsoft, Apple, Alphabet, Amazon and Facebook) rose 51% on average. These five stocks ended the year comprising 16.8% of the cap weight index, more than the smallest 295 stocks combined (16.2%). The Syntax Stratified LargeCap Index (SYLC) broadly kept up, returning 29.3% for the year while maintaining its diversified exposure (only 1.5% weight in the big 5).
Core Index Comparison: Cap Weight versus Stratified Weight
Source: Syntax. Performance does not reflect fees or implementation costs as an investor cannot directly invest in an index.
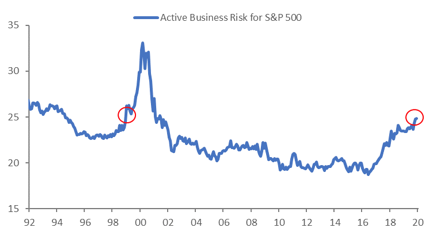
Active Business Risk: Most concentrated market since June 1999
As we have written in recent quarters, the current S&P 500 (cap weighted) index exposures are troubling because of their narrow focus in the IT and Information sectors. Such related business risks can amplify the effect of macro and micro shocks on the broad index return.
Active Business Risk, our measure of aggregate index bias toward sectors and industries has risen to 24.9, a level last seen in June 1999. Furthermore, at 19.8x, the 12m forward P/E ratio for the S&P 500 is near its post DotCom bubble peak of 20x (December 2017). Expensive valuations and concentrated markets is a recipe for future volatility. Active Business Risk for S&P 500 Source: Syntax
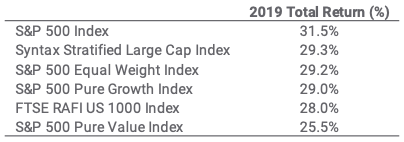
Alternative Weight indices struggle to keep up with Cap Weight
In the S&P 500, the largest ten companies contributed 9.2 percentage points of total return (almost one third of the overall index’s 31.5% performance for the year). Both the S&P 500 Pure Value and the S&P 500 Pure Growth underperformed the vanilla index – a phenomenon that has never before happened in a year where all three indices went up (going back to the inception of the pure factor indices in 1996).
Strong momentum effects in the largest stocks created a tough environment for alternative weight indices to outperform their cap weighted counterparts. The Syntax Stratified LargeCap Index performed favorably against other strategies. Alternative Weight Index Performance in 2019 Source: Syntax, FactSet
Small Cap & Mid Cap Offer Different Biases to LargeCap Indices
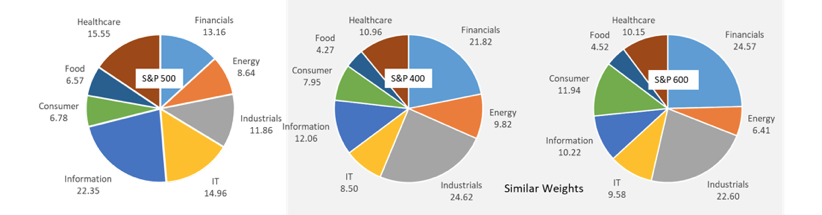
When branching out from the S&P 500 into the small (S&P 600) or mid cap (S&P 400) universes, investors are exposing themselves to different types of business risks. Almost half of the S&P 400 and S&P 600 indices are made up of just two sectors, Financials and Industrials, while less than 10% of their weight is allocated to the IT sector. Interestingly, the broad sector weights of the S&P 400 and S&P 600 are similar to one another.
Sector Weights for S&P 500 (LargeCap), S&P MidCap 400 and S&P SmallCap 600 Source: Syntax, FactSet
This underweight in tech led to underperformance of both SmallCap and MidCap indices versus the large caps, given that IT was the best performing sector in all three universes. Unlike the Stratified LargeCap index, the Stratified SmallCap and Stratified MidCap indices have a larger exposure to technology than their cap weighted versions. Addressing this bias led the Stratified SmallCap Index to rise 23.9% in 2019, versus 22.8% for the S&P 600. The Syntax Stratified MidCap index performed in-line with the Stratified SmallCap index (23.8%), underperforming the S&P 400 (26.2%) for the year. The majority of the S&P 400 outperformance was due to the largest two cap-weighted sectors, namely the Industrials and Financials, where the concentrated sector exposures benefited from strong relative performance.
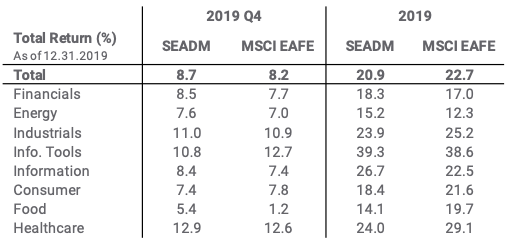
Brexit and trade war news eases uncertainty internationally
Q4 2019 gave some much-needed forward momentum to the ongoing Brexit and the US-China Trade War sagas, helping MSCI EAFE to rise 8.2% for the quarter. The “risk on” trade that played out in the US markets was reflected by an 80% correlation in the pattern of EAFE vs S&P 500 sector returns. Similar to the US LargeCap universe, the Stratified Europe & Asia Developed Markets (SEADM) index underperformed its cap weighted benchmark for the full year (20.9% vs 22.7%).
The announcement of the “phase one trade deal” between the US and China is certainly a step in the right direction, but some of the most contentious details remain unresolved and will likely lead to continued uncertainty and volatility in 2020.
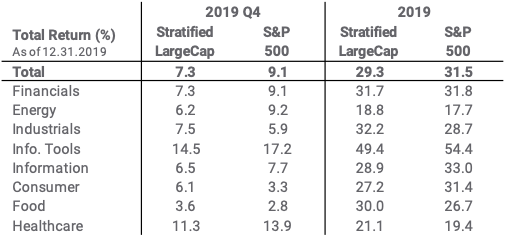
Healthcare and Financials Outperform in Q4 after Lagging
The Healthcare sector was the worst performing sector through the third quarter, despite the announcement of two of the year’s largest mergers (Bristol-Myers Squibb’s $92bn acquisition of Celgene and AbbVie’s $87bn acquisition of Allergan). Through the end of Q3, the Stratified Healthcare index underperformed SYLC by 12.1%, while cap weighted Healthcare underperformed the S&P 500 by 15.7%. However, the S&P 500 Healthcare sector reversed in Q4, outperforming the broad index by 4.8%. Volatility to both the upside and the downside in the Healthcare sector saw the stratified weight index outperform the cap weighted version, highlighting the importance of a diversified approach.
The stratified weight Financials lagged its cap weight counterpart because of strong returns by capital markets banks after robust earnings announcements. This group returned 15.2% in the S&P 500 and had almost three times the stratified weight exposure (CW: 5.7%, Strat: 2.1%).
Sector and Composite Performance
US LargeCap (S&P 500 universe)
Source: Syntax. Performance does not reflect fees or implementation costs as an investor cannot directly invest in an index.
Europe & Asia Developed Markets (MSCI EAFE universe) Source: Syntax. Performance does not reflect fees or implementation costs as an investor cannot directly invest in an index.
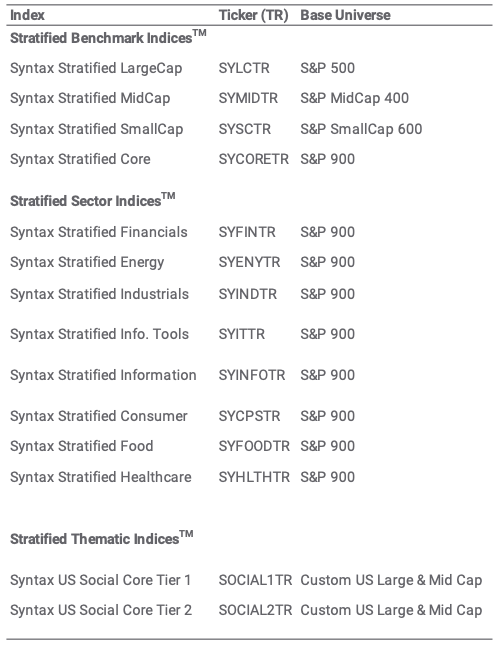
Syntax Core Index Suite
Important Disclaimers
Past performance is no guarantee of future results. Charts and graphs are provided for illustrative purposes only.
The Syntax Stratified LargeCap Index, Syntax Stratified MidCap Index, Syntax Stratified SmallCap Index, and Syntax Europe & Asia Developed Markets (“SEADM”) Index are the property of Syntax, LLC, which has contracted with S&P Opco, LLC (a subsidiary of S&P Dow Jones Indices LLC) to calculate and maintain the Indices. The Indices are not sponsored by S&P Dow Jones Indices or its affiliates or its third party licensors (collectively, “S&P Dow Jones Indices”). S&P Dow Jones Indices will not be liable for any errors or omissions in calculating the Index. “Calculated by S&P Dow Jones Indices” and the related stylized mark(s) are service marks of S&P Dow Jones Indices and have been licensed for use by Syntax, LLC. S&P® is a registered trademark of Standard & Poor's Financial Services LLC (“SPFS"), and Dow Jones® is a registered trademark of Dow Jones Trademark Holdings LLC (“Dow Jones”). The MSCI EAFE Index was used by Syntax, LLC as the reference universe for selection of the companies included in the SEADM Index. MSCI does not in any way sponsor, support, promote or endorse the Index. MSCI was not and is not involved in any way in the creation, calculation, maintenance or review of the Index. The MSCI EAFE Index was provided on an “as is” basis. MSCI, each of its affiliates and each other person involved in or related to compiling, computing or creating the MSCI EAFE Index (collectively, the “MSCI Parties”) expressly disclaim all warranties (including, without limitation, any warranties of originality, accuracy, completeness, timeliness, non‐infringement, merchantability and fitness for a particular purpose). Without limiting any of the foregoing, in no event shall any of the MSCI Parties have any liability for any direct, indirect, special, incidental, punitive, consequential (including, without limitation, lost profits) or any other damages in connection with the MSCI EAFE Index or the SEADM Index. Prior to March 19, 2018, the SEADM Index was calculate by NYSE. Sector subsets of the Syntax Stratified LargeCap, Syntax Stratified MidCap, and SEADM Indices are calculated using model performance generated in FactSet, and as such may differ from index calculations performed by S&P Dow Jones Indices. Syntax®, Stratified®, Stratified Indices®, Stratified-Weight™, Stratified Benchmark Indices™, Stratified Sector Indices™, Stratified Thematic Indices™, and Locus® are trademarks or registered trademarks of Syntax, LLC and its affiliate Locus LP. FactSet® is a registered trademark of FactSet Research Systems, Inc.
Index performance does not represent actual fund or portfolio performance and such performance does not reflect the actual investment experience of any investor. An investor cannot invest directly in an index. In addition, the results actual investors might have achieved would have differed from those shown because of differences in the timing, amounts of their investments, and fees and expenses associated with an investment in a portfolio invested in accordance with an index. None of the Syntax Indices or the benchmark indices portrayed herein charge management fees or incur brokerage expenses, and no such fees or expenses were deducted from the performance shown; provided, however that the returns of any investment portfolio invested in accordance with such indices would be net of such fees and expenses. Additionally, none of such indices lend securities, and no revenues from securities lending were added to the performance shown.
The S&P 500® Index is an unmanaged index considered representative of the US mid- and large-cap stock market. The MSCI EAFE Index is an unmanaged index considered representative of the European, Australian, and East Asian large-cap stock market. Benchmark data for the S&P 500, S&P MidCap 400, and S&P SmallCap 600 Indices are provided by S&P Dow Jones through FactSet®. Benchmark data for the MSCI EAFE index is provided by MSCI through FactSet.
This document is for informational purposes only and is not intended to be, nor should it be construed or used as an offer to sell, or a solicitation of any offer to buy, any security. Additionally, the information herein is not intended to provide, and should not be relied upon for, legal advice or investment recommendations. You should make an independent investigation of the matters described herein, including consulting your own advisors on the matters discussed herein. In addition, certain information contained in this factsheet has been obtained from published and non-published sources prepared by other parties, which in certain cases have not been updated through the date hereof. While such information is believed to be reliable for the purpose used in this factsheet, such information has not been independently verified by Syntax and Syntax does not assume any responsibility for the accuracy or completeness of such information. Syntax LLC, its affiliates and their independent providers are not liable for any informational errors, incompleteness, or delays, or for any actions taken in reliance on information contained herein.
Certain information contained in this presentation is non-public, proprietary and highly confidential and is being submitted to selected recipients only. Accordingly, by accepting and using this factsheet, you will be deemed to agree not to disclose any information contained herein except as may be required by law. This factsheet and the information herein may not be reproduced (in whole or in part), distributed or transmitted to any other person without the prior written consent of Syntax. Distribution of Syntax data and the use of Syntax indices to create financial products requires a license with Syntax and/or its licensors. Investments are not FDIC insured, may lose value and have no bank guarantee.