Stratified LargeCap outperforms S&P 500 during banner year
The S&P 500 finished 2021 with its strongest quarter of the year (11.0%), completing its third best annual performance of the past 20 years (28.7%). The Stratified LargeCap Index also performed strongly (9.6%) in the fourth quarter and outperformed the cap weighted benchmark for the full year (29.4%). A preference for value sectors like Energy, Industrials and Financials lifted the Stratified LargeCap index above its cap weighted counterpart (Exhibit 1).
The S&P MidCap 400 and SmallCap 600 indices also had strong quarters, rising 8.0% and 5.6% respectively. Stratified Weight slightly underperformed in the mid caps for the full year (23.4%), though outperformed in the small caps (27.7%). Unlike the large cap indices, the S&P 400 and 600 are dominated by Energy and Financial companies which performed well. International benchmarks lagged their US counterparts in 2021, with Stratified Weight struggling as larger companies significantly outperformed. MSCI EAFE was driven by large IT (Sony and ASML) and Consumer names (LVMH), which account for a much larger weight in MSCI EAFE than SEADM.
Exhibit 1. Core Index Comparison Source: Syntax, S&P Dow Jones Indices, MSCI. Total return performance does not reflect fees or implementation costs as an investor cannot directly invest in an index. * Syntax Stratified Europe & Asia Developed Markets Index, based on the MSCI EAFE universe.
Fed commitment to low rates fuels end of year rally
The crippling supply chain problems, which were widely reported in September, dissipated in Q4 and the market recovered its September losses. A strong Q3 earnings season, particularly for key large cap software and information companies also helped the S&P 500 in October – Microsoft and Alphabet posted much stronger than expected results, both beating their earnings estimates by 10% and rallying 5%. As inflation concerns began to dominate headlines in November, the Fed committed to their accommodative policy stance, dismissing recent data as transient. High growth and highly leveraged companies outperformed once more. These trends supported tech and hence cap weighted US large cap indices once again outperformed alternatively weighted ones. In December, the then new Omicron COVID variant raised fresh concerns for investors, but as with previous surges, the market was able to shrug off its initial worries as the Fed repeated their commitment to low interest rates. Risk assets, and in particular value stocks, rallied in December and Stratified Weight recovered some of its relative underperformance from the previous two months (Exhibit 2).
Exhibit 2. Q4 2021 Performance, month-by-month
Source: Syntax, S&P Dow Jones Indices. Total return performance does not reflect fees or implementation costs as an investor cannot directly invest in an index.
At the sector level, the outperformance of the S&P 500 was driven by large cap companies in the IT sector. Apple had a blowout quarter, rising 25.7% and together with Microsoft (which rose 19.5%) account for 11.9% of the index – almost as much weight as the entire IT exposure of the Stratified LargeCap index. The result was that the cap-weighted IT sector outperformed the Stratified Weighted one by 4.2% for the quarter.
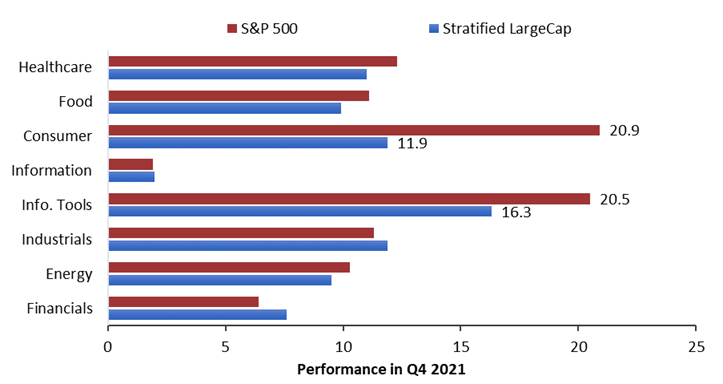
As was the case in Q3, large Cap consumer stocks rose in the fourth quarter. The five largest companies account for over half of the cap weighted consumer sector and all delivered very strong performance: Tesla (up 36.3% in Q4); Home Depot (27.0%); Proctor & Gamble (17.7%); Lowes (27.9%) and Nike (15.0%). The cap-weighted consumer sector rose 20.9% strongly outperforming the equal-weighted (10.8%) and Stratified Weight (11.9%) consumer sectors (Exhibit 3).
Exhibit 3. US LargeCap Q4 sector performance by different weighting methodologies
Total return performance from 9.30.2021 – 12.31.2021. Performance does not reflect fees or implementation costs as an investor cannot directly invest in an index. Source: Syntax, S&P Dow Jones Indices.
Trending and Emerging Themes
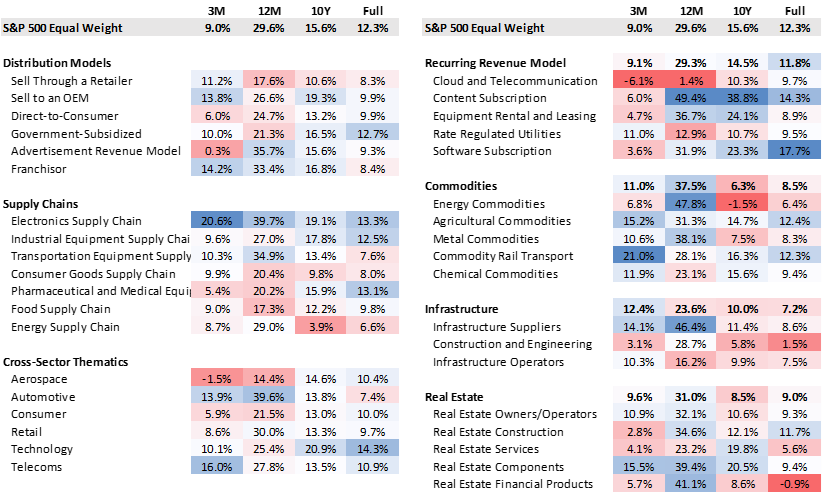
Affinity™ Syntax’s market intelligence technology can identify dozens of investable themes, including Technology, Tourism, Retail, ESG, Infrastructure, Commodities and many more. Such themes often exhibit persistent performance trends, which we observe as they develop (Exhibit 4).
As the pandemic lingered on, the most polarizing trend in Q4 was a preference for auto transport versus air. Auto manufacturers rallied strongly in Q4, Ford (47.4%) even outperformed Tesla (36.3%). Auto services also outperformed the market: O’Reilly (ORLY, 15.6%), Autozone (AZO, 23.5%) and Genuine Parts (GPC, 16.4%) all rose. In contrast, airlines all corrected course, with negative returns from Jetblue (-6.9%), Southwest (-16.7%), American Airlines (-12.5%), and United Airlines (-8.0%). The correction was a result of the high oil price (>$80) and the emergence of the highly contagious Omicron COVID variant, once again deterring travelers.
As the supply chain opened up, Commodity Rail Transport stocks: CSX (26.8%), Union Pacific (29.1%), and Norfolk Southern (24.9%) all rebounded sharply. As industrial channels remained open for business, infrastructure suppliers, particularly infrastructure materials companies like Freeport (28.6%); Nucor (16.4%), Vulcan (22.9%) and Martin Marietta (29.1%) continued their strong performance in Q4.
Exhibit 4. Thematic Performance and Exposure within the US LargeCap universe
Source: Syntax, Affinity, S&P Dow Jones Indices. Performance is calculated as the weighted average total return of the subset of the S&P 500 Equal Weight Index constituents who are members of the Affinity Theme. QoQ shows total return for 9.30.21 to 12.31.21. YoY shows total return from 12.31.20 to 12.31.21. Full performance period uses period from 12.31.1991 when available. Performance does not reflect fees or implementation costs.
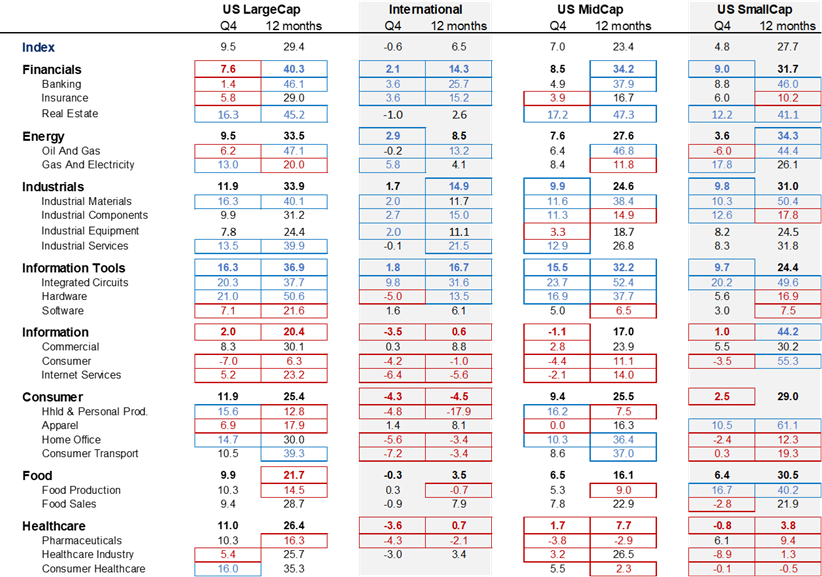
Exhibit 5. Sector performance for Stratified US size segments and Stratified International universes
Source: Syntax, Affinity™. Performance does not reflect fees or implementation costs.
Important Disclaimers
This document is for informational purposes only and is not intended to be, nor should it be construed or used as an offer to sell, or a solicitation of any offer to buy, any security. Additionally, the information herein is not intended to provide, and should not be relied upon for, legal advice or investment recommendations. You should make an independent investigation of the matters described herein, including consulting your own advisors on the matters discussed herein. In addition, certain information contained in this factsheet has been obtained from published and non-published sources prepared by other parties, which in certain cases have not been updated through the date hereof. While such information is believed to be reliable for the purpose used in this factsheet, such information has not been independently verified by Syntax and Syntax does not assume any responsibility for the accuracy or completeness of such information. Syntax LLC, its affiliates and their independent providers are not liable for any informational errors, incompleteness, or delays, or for any actions taken in reliance on information contained herein.
Past performance is no guarantee of future results. The inception date of the Syntax Stratified LargeCap and Syntax Stratified MidCap Indices was December 27, 2016. The inception date of the Syntax Stratified SmallCap Index was January 3, 2020. The inception date of the Syntax Europe & Asia Developed Markets (“SEADM”) Index was January 1, 2016. The inception date of the Syntax Real Asset Index was July 1, 2015. Charts and graphs are provided for illustrative purposes only.
Index performance does not represent actual fund or portfolio performance and such performance does not reflect the actual investment experience of any investor. An investor cannot invest directly in an index. In addition, the results actual investors might have achieved would have differed from those shown because of differences in the timing, amounts of their investments, and fees and expenses associated with an investment in a portfolio invested in accordance with an index. None of the Syntax Indices or the benchmark indices portrayed herein charge management fees or incur brokerage expenses, and no such fees or expenses were deducted from the performance shown; provided, however that the returns of any investment portfolio invested in accordance with such indices would be net of such fees and expenses. Additionally, none of such indices lend securities, and no revenues from securities lending were added to the performance shown.
The Syntax Stratified LargeCap Index, Syntax Stratified MidCap Index, Syntax Stratified SmallCap Index, SEADM Index are the property of Syntax, LLC, which has contracted with S&P Opco, LLC (a subsidiary of S&P Dow Jones Indices LLC) to calculate and maintain the Indices. The Indices are not sponsored by S&P Dow Jones Indices or its affiliates or its third party licensors (collectively, “S&P Dow Jones Indices”). S&P Dow Jones Indices will not be liable for any errors or omissions in calculating the Index. “Calculated by S&P Dow Jones Indices” and the related stylized mark(s) are service marks of S&P Dow Jones Indices and have been licensed for use by Syntax, LLC. S&P® is a registered trademark of Standard & Poor's Financial Services LLC (“SPFS"), and Dow Jones® is a registered trademark of Dow Jones Trademark Holdings LLC (“Dow Jones”). The MSCI EAFE Index was used by Syntax, LLC as the reference universe for selection of the companies included in the SEADM Index. MSCI does not in any way sponsor, support, promote or endorse the Index. MSCI was not and is not involved in any way in the creation, calculation, maintenance or review of the Index. The MSCI EAFE Index was provided on an “as is” basis. MSCI, each of its affiliates and each other person involved in or related to compiling, computing or creating the MSCI EAFE Index (collectively, the “MSCI Parties”) expressly disclaim all warranties (including, without limitation, any warranties of originality, accuracy, completeness, timeliness, non‐infringement, merchantability and fitness for a particular purpose). Without limiting any of the foregoing, in no event shall any of the MSCI Parties have any liability for any direct, indirect, special, incidental, punitive, consequential (including, without limitation, lost profits) or any other damages in connection with the MSCI EAFE Index or the SEADM Index. Prior to March 19, 2018, the SEADM Index was calculate by NYSE. Sector subsets of the Syntax Stratified LargeCap, Syntax Stratified MidCap, and SEADM Indices are calculated using model performance generated in FactSet, and as such may differ from index calculations performed by S&P Dow Jones Indices. The Affinity Thematics are the property of Syntax, LLC, which has calculated their performance using Affinity™. Syntax will not be liable for any errors or omissions in calculating the Affinity Thematics. Syntax®, Stratified®, Stratified Indices®, Stratified-Weight™, Stratified Benchmark Indices™, Stratified Sector Indices™, Stratified Thematic Indices™, Affinity™, and Locus® are trademarks or registered trademarks of Syntax, LLC and its affiliate Locus LP.
The S&P 500® Index is an unmanaged index considered representative of the US mid- and large-cap stock market. The MSCI EAFE Index is an unmanaged index considered representative of the European, Australian, and East Asian large-cap stock market. Benchmark data for the S&P 500, S&P 500 Equal Weight, S&P MidCap 400, S&P MidCap 400 Equal Weight, S&P SmallCap 600, S&P SmallCap 600 Equal Weight, and S&P Real Assets Equity Indices are provided by S&P Dow Jones through FactSet®. Benchmark data for the MSCI EAFE index is provided by MSCI through FactSet.