Regime Shifts: Value regime looks set to last (April Update)
By Simon Whitten and Hezel Gadzikwa on
The 3.6% sell-off in the S&P 500 on Friday (4/29) capped a dismal April for the world’s most traded index (-8.72%).
As we wrote in our February note Regime Shifts: Why the S&P 500 could underperform Alternatively Weighted ETFs, “[the S&P 500] is highly exposed to several potential headwinds in 2022, including interest rate hikes, rising vaccination rates, increased regulation, and overly optimistic valuations. A change in the prevailing market dynamic could cause one (or more) of these headwinds to reverse the long-run market trends and see cap weighted indices underperform alternatively weighted products. The Stratified LargeCap Index outperformed its cap weighted counterpart by 3.12% in April.”
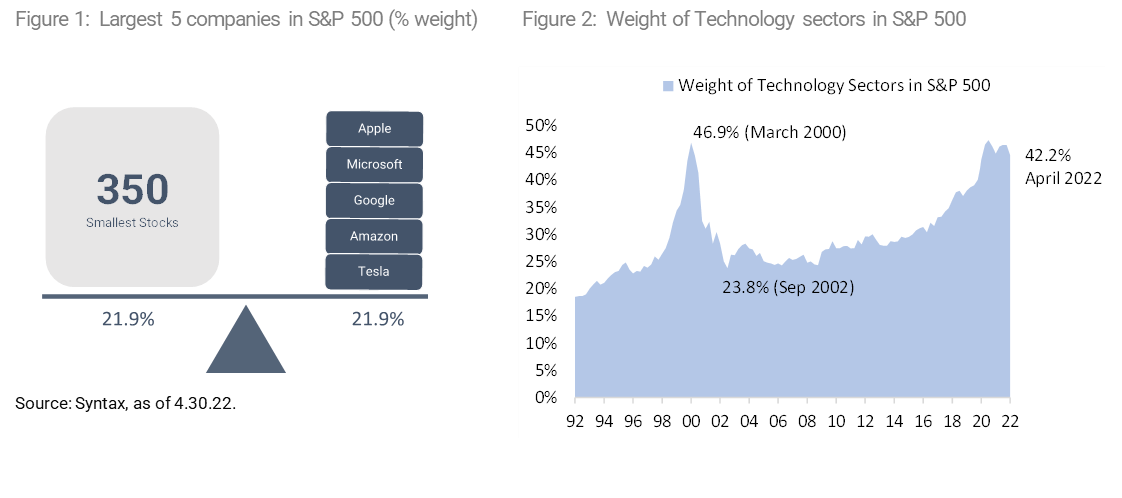
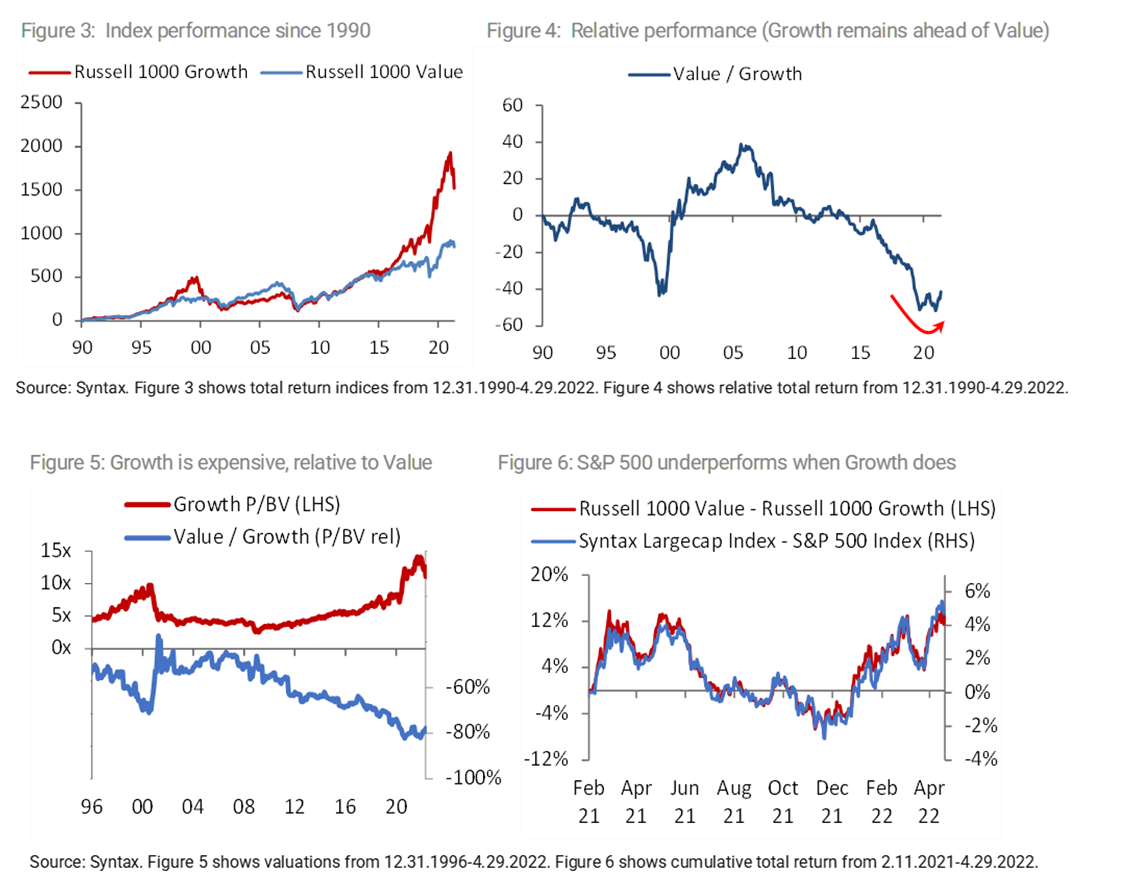
The environment for a sustained outperformance of alternative weighted core equity products remains in place even after the recent correction. The five largest companies in the S&P 500 make up the same weight as the smallest 350 companies (21.9%) and bias the index heavily towards the technology sector (Figure 1). Though slightly off its recent high (46.5% on September 2021), the Information and IT sectors comprise 42.2% of the index. High concentration raises the risk of crowded exits and could fuel persistent underperformance (Figure 2), especially given that the investment regime continues to favor value stocks.
Even after a significant decline, the S&P 500 remains highly concentrated.
April’s 8.7% decline coincided with the US long bond hitting 3 percent (to 3 decimal places) for the first time in 3 years. Even if bad news doesn’t necessarily come in threes, the normalization in interest rates represents a regime shift away from the liquidity fueled growth frenzy since 2019.
Furthermore, with 50% of the S&P 500 having reported results, the Q1 earnings season has also been problematic for Big Tech. Netflix was the biggest loser, down 45% since reporting its first decline in subscribers on April 20th. Alphabet missed on the top and bottom lines and Amazon reported its first loss in seven years falling 14% on the day (4/28). Though Facebook managed to beat its Q1 expectations, the company’s pivot into the Metaverse has been met with a 38% decline since its earnings announcement on 2/2.
For those investors who are tempted to buy into the Growth sell-off we caution that the long-term charts for Value versus Growth show plenty of scope for the recent trend to persist (i.e., for Value to outperform, Figures 3 & 4). In Figure 4, relative return is defined as the quotient of the Russell 1000 Value and Russell 1000 Growth Indices, normalized such that a value of 0 indicates equal cumulative performance between value and growth; decreasing values indicate growth outperformance and increasing values indicate value outperformance.
Even in light of the recent 17.11% outperformance of Value vs Growth this year, Growth remains 79% ahead of Value since 2016 (165% vs 86%). The P/BV multiple of the Russell 1000 Growth index is 11.1x, higher than it was at the height of the DotCom bubble (Figure 5). In relative terms, Value is at a 78% discount (2.46x) – significantly wider than the 67% discount seen in March 2000. The shift from growth to value has strong implications for the performance of stratified vs cap weight, as shown by the significant correlation in Figure 6. Year to date, as value has outperformed growth, the Stratified LargeCap has outperformed the S&P 500 by 6.84%.
Conclusion
We therefore reiterate our sentiment from the Regime Shifts note: the S&P 500 index remains more concentrated in mega-cap technology stocks than it was at the height of the DotCom Bubble, leaving it highly exposed to changes in the long-term investment regime, namely the normalization of interest rates and a shift to value-conscious investing.
If inflation persists, it is likely that the Fed will have to raise rates faster than anticipated, amplifying the headwind for growth companies. Furthermore, with valuations at historical highs, disappointing quarterly earnings, could manifest as a crowded exit out of technology into some of the underserved sectors in the S&P 500, such as Energy, the Consumer or Food.
This shift would see the S&P 500 continue to underperform alternatively weighted products such as the Syntax Stratified LargeCap Index, which reweights the same stocks as the S&P 500, but with diversified exposures that allocate equally across all major sectors and is therefore not overweight in technology or any other business risk.
Important Disclaimers
This document is for informational purposes only and is not intended to be, nor should it be construed or used as an offer to sell, or a solicitation of any offer to buy, any security. Additionally, the information herein is not intended to provide, and should not be relied upon for, legal advice or investment recommendations. You should make an independent investigation of the matters described herein, including consulting your own advisors on the matters discussed herein. In addition, certain information contained in this factsheet has been obtained from published and non-published sources prepared by other parties, which in certain cases have not been updated through the date hereof. While such information is believed to be reliable for the purpose used in this factsheet, such information has not been independently verified by Syntax and Syntax does not assume any responsibility for the accuracy or completeness of such information. Syntax LLC, its affiliates and their independent providers are not liable for any informational errors, incompleteness, or delays, or for any actions taken in reliance on information contained herein.
Past performance is no guarantee of future results. The inception date of the Syntax Stratified LargeCap Index was December 27, 2016.Charts and graphs are provided for illustrative purposes only.
Index performance does not represent actual fund or portfolio performance and such performance does not reflect the actual investment experience of any investor. An investor cannot invest directly in an index. In addition, the results actual investors might have achieved would have differed from those shown because of differences in the timing, amounts of their investments, and fees and expenses associated with an investment in a portfolio invested in accordance with an index. None of the Syntax Indices or the benchmark indices portrayed herein charge management fees or incur brokerage expenses, and no such fees or expenses were deducted from the performance shown; provided, however that the returns of any investment portfolio invested in accordance with such indices would be net of such fees and expenses. Additionally, none of such indices lend securities, and no revenues from securities lending were added to the performance shown.
The Syntax Stratified LargeCap Index (“the Index”) is the property of Syntax, LLC, which has contracted with S&P Opco, LLC (a subsidiary of S&P Dow Jones Indices LLC) to calculate and maintain the Index. The Index is not sponsored by S&P Dow Jones Indices or its affiliates or its third party licensors (collectively, “S&P Dow Jones Indices”). S&P Dow Jones Indices will not be liable for any errors or omissions in calculating the Index. “Calculated by S&P Dow Jones Indices” and the related stylized mark(s) are service marks of S&P Dow Jones Indices and have been licensed for use by Syntax, LLC. S&P® is a registered trademark of Standard & Poor's Financial Services LLC (“SPFS"), and Dow Jones® is a registered trademark of Dow Jones Trademark Holdings LLC (“Dow Jones”). Syntax®, Stratified®, Stratified Indices®, Stratified-Weight™, Stratified Benchmark Indices™, Stratified Sector Indices™, Stratified Thematic Indices™, Affinity™, and Locus® are trademarks or registered trademarks of Syntax, LLC and its affiliate Locus LP.