
By Paul Kenney, CFA, Hezel Gadzikwa on
The Uncertain Road Ahead
The world is a complicated place right now, packed with uncertainty tied to a host of issues including Russia’s invasion of Ukraine; inflation running at over eight percent per year, driven by food and energy price increases; continued supply chain challenges; and the lingering impacts of the Pandemic. Adding to this backdrop are questions surrounding Fed policy. How quickly and how high does the Fed need to raise interest rates to bring inflation down to its target? Can they engineer a soft landing given the consensus they are behind the curve?
In this environment, how does an investor position their portfolio? There are many options to consider, but the challenge is the investment advice of today can become stale or dated very quickly. Consider the changing economic and geopolitical landscape of the past six months.
The economic narrative for much of 2021 was the spike in inflation was transitory, and, as the supply chain pressures from COVID unwound, inflationary pressures would subside. However, the narrative for 2022 is moving towards inflation being sticky and more problematic, a situation further complicated by the lingering Russia-Ukraine conflict. With little on the horizon to alleviate either concern, the future remains far from predictable.
Investment Advice is Often a Moving Target
Investment advice typically incorporates numerous factors, which can include:
- Reviewing historical asset class performance to help understand risk premiums and to guide future expectations.
- Analysis of present valuations to assess attractiveness of an asset class relative to its history and other asset classes.
- Forward looking thoughts about how the future will unfold and how this will influence prospective returns.
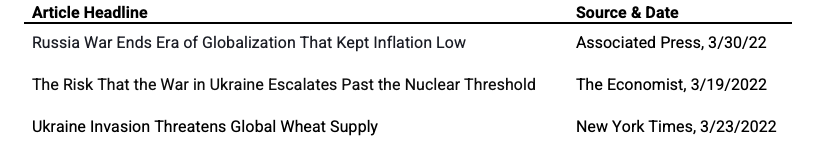
This last point above is particularly challenging as thoughts on the future are recalibrated based on what has transpired. What you thought may have been a favorable asset allocation based on a view that inflation was transitory may not play out as expected given the changing global dynamics tied to the war in Ukraine (Exhibit 1). While recent months have been especially volatile, a quick review of the past 25 years shows unanticipated events appear relatively frequently. This ignominious list includes the collapse of the tech bubble, 9/11, the Great Financial Crisis, the European Debt Crisis, and the COVID-19 Pandemic.
So, what does the future hold? We don’t know. What should you do? Our advice is to seek balance and diversify. By seeking balance, we recognize that various public equity benchmarks and indices used by investors have biases, but that these biases can be managed through prudent index construction.
Exhibit 1: Uncertainty is High, and the Impact of the Russia-Ukraine Situation is Unknown
Addressing Index Biases
Exhibit 2 shows that the major public equity benchmarks contain significant sector concentrations and that these biases vary across the indices.
Exhibit 2: Sector Exposure by Index
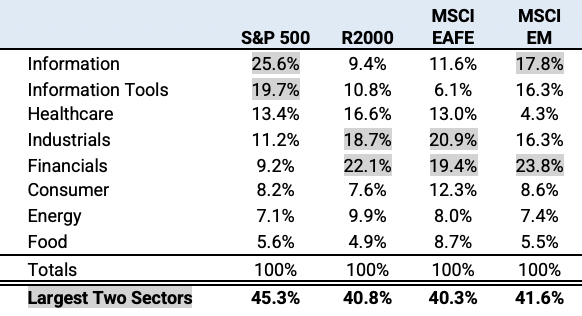
The bias of the S&P 500 to tech stocks, proxied here by the allocations to Information and Information Tools sectors, has been well documented, and has been a major driver of the disparate performance of the S&P 500 to different indices over the last two decades. Exhibit 3 below highlights the sector exposure of the S&P 500 from 1992 to year end 2021.
Exhibit 3: Historical S&P 500 Sector Exposure: 1992-2021
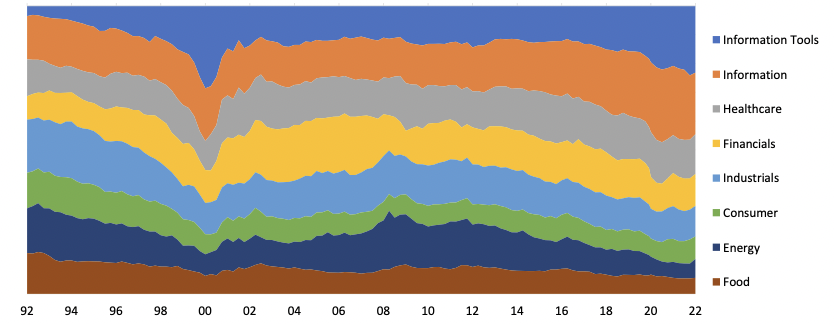
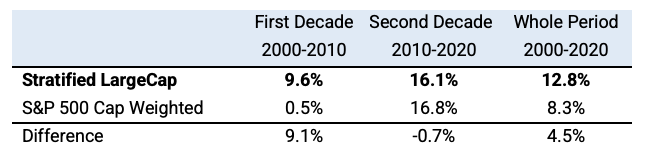
The period from 1/1/2000 to 12/31/2009 was a “lost decade” where the S&P 500 returned just 0.45% annualized. With inflation averaging 2.7% over this period, the S&P 500 annualized real return was negative. Compounded over the course of the decade, investors lost 20.4% cumulatively on an inflation-adjusted basis. The period from 1/1/2010 to 12/31/2019 was a mirror image: the S&P 500 returned 16.1% annualized, producing a nominal cumulative return of 345%. With inflation averaging 2.4% per year for the decade, the S&P produced an impressive annualized real return of 14.4%.
Sector biases move with the ebb and flow of the markets. Exhibit 3 shows how the Information Tools sector was negligible back in 1992 and grew to over 25% by the end of the 1990’s before being reduced roughly in half by 2002. Today, Information Tools has grown back to roughly 20%, and when combined with the Information sector comprises 45.3% of the index. The index is increasingly tech focused, sectors like Food (5%), Energy (5%) and Consumer Products (8%) are relatively small components on a market cap basis despite being important parts of the economy.
To seek balance, Syntax’s approach is to take a public equity benchmark, such as the S&P 500, and reweight the holdings in the benchmark to maximize business risk diversification (Exhibit 4).
To seek balance, Syntax’s approach is to take a public equity benchmark, such as the S&P 500, and reweight the holdings in the benchmark to maximize business risk diversification (Exhibit 4).
Exhibit 4: Historical Syntax Stratified LargeCap Index Sector Exposure: 1992-2021

Exhibit 4 shows the Syntax Stratified LargeCap Index, which equally weights eight primary sectors, targeting a 12.5% weight to each at each quarterly rebalance. This approach has the benefit of avoiding concentration risk to a specific sector and balancing economic exposure across the portfolio. We believe this captures the broadest, unbiased equity market risk premium.
Stratified Weight Indices also diversify risk concentrations within each sector. Exhibit 5 shows a snapshot of the exposure to the Information Sector within the Stratified LargeCap Index. There are three sub sectors to Information, highlighted by the different colors in the chart. The Internet Services and Websites sub segment (in blue) has three components (Online Distribution and Networks, Internet Services, and Search and Social Networks), each weighted equally. The Commercial Information sub segment (in orange) has three components (Management and IT Services, Investment Services, and Transaction Services), also equally weighted. The same methodology applies to the Media and Telecommunication sub segment (yellow) which is equally divided into Content providers and Telecommunication networks. The same cannot be said about S&P 500 index, which concentrates in the Internet Services and Websites sub segment (blue) and avoids Media and Telecommunication (yellow).
Exhibit 5: Diversification Within Sectors: Information Sector Example
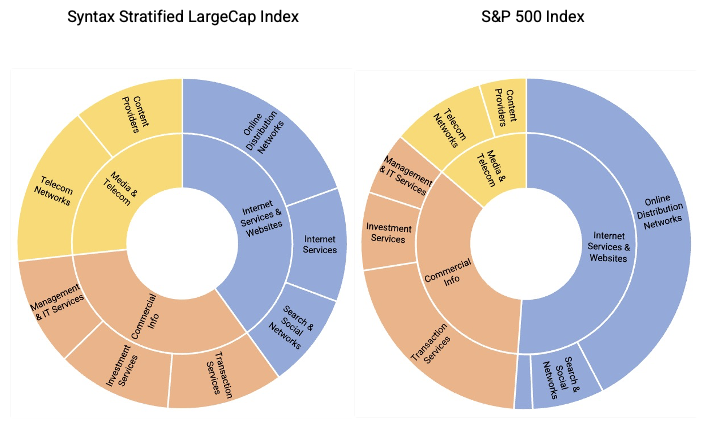
Exhibit 6 below compares the performance of the Stratified LargeCap Index to the S&P 500 Index (cap-weighted). The results highlight how this balancing of business risk led to more consistent long-term performance.
Exhibit 6: Stratified LargeCap Index vs. S&P 500 Index
Conclusion
The world is filled with uncertainty, which creates challenges for investors in positioning their portfolios. The success of a portfolio is in large part determined by how well it is positioned relative to a set of events that are not knowable today. Indices such as the S&P 500 concentrate in particular sectors and industries, leading to biases that can be diversified. We believe by balancing exposure to business risk by reweighting the holdings within various public equity benchmarks, we can construct indices that are more likely to mitigate the risks associated with future unanticipated events.
Important Disclaimers
This document is for informational purposes only and is not intended to be, nor should it be construed or used as an offer to sell, or a solicitation of any offer to buy, any security. Additionally, the information herein is not intended to provide, and should not be relied upon for, legal advice or investment recommendations. You should make an independent investigation of the matters described herein, including consulting your own advisors on the matters discussed herein. In addition, certain information contained in this document has been obtained from published and non-published sources prepared by other parties, which in certain cases have not been updated through the date hereof. While such information is believed to be reliable for the purpose used in this document, such information has not been independently verified by Syntax and Syntax does not assume any responsibility for the accuracy or completeness of such information. Syntax LLC, its affiliates and their independent providers are not liable for any informational errors, incompleteness, or delays, or for any actions taken in reliance on information contained herein.
Past performance is no guarantee of future results. All performance presented prior to the index inception date is backtested performance. Backtested performance is not actual performance but is hypothetical. The inception date of the Syntax Stratified LargeCap Index was December 27, 2016. The backtest calculations are based on the same methodology that was in effect when the index was officially launched. However, back-tested data may reflect the application of the index methodology with the benefit of hindsight, and the historic calculations of an index may change from month to month based on revisions to the underlying economic data used in the calculation of the index. Charts and graphs are provided for illustrative purposes only.
Index performance does not represent actual fund or portfolio performance and such performance does not reflect the actual investment experience of any investor. An investor cannot invest directly in an index. In addition, the results actual investors might have achieved would have differed from those shown because of differences in the timing, amounts of their investments, and fees and expenses associated with an investment in a portfolio invested in accordance with an index. None of the Syntax Indices or the benchmark indices portrayed herein charge management fees or incur brokerage expenses, and no such fees or expenses were deducted from the performance shown; provided, however that the returns of any investment portfolio invested in accordance with such indices would be net of such fees and expenses. Additionally, none of such indices lend securities, and no revenues from securities lending were added to the performance shown.
The Syntax Stratified LargeCap Index ("the Index") is the property of Syntax, LLC, which has contracted with S&P Opco, LLC (a subsidiary of S&P Dow Jones Indices LLC) to calculate and maintain the Index. The Index is not sponsored by S&P Dow Jones Indices or its affiliates or its third-party licensors (collectively, “S&P Dow Jones Indices”). S&P Dow Jones Indices will not be liable for any errors or omissions in calculating the Index. “Calculated by S&P Dow Jones Indices” and the related stylized mark(s) are service marks of S&P Dow Jones Indices and have been licensed for use by Syntax, LLC. S&P® is a registered trademark of Standard & Poor's Financial Services LLC (“SPFS"), and Dow Jones® is a registered trademark of Dow Jones Trademark Holdings LLC (“Dow Jones”). Syntax®, Stratified®, Stratified Indices®, Stratified-Weight™, Stratified Benchmark Indices™, Stratified Sector Indices™, Stratified Thematic Indices™, Affinity™, and Locus® are trademarks or registered trademarks of Syntax, LLC and its affiliate Locus LP.