In 2019, there were a total of one-hundred-twenty-nine Initial Public Offerings (IPOs) in the United States. While the count is down from the 160 companies which went public in 2018, the market capitalization of the 2019 companies were cumulatively valued at $216.9B, a significant increase from the $173.9B collective value in 2018. Ranging from ride-share apps to early-stage pharmaceuticals to vegan meat substitutes, these IPOs provide a reflection of some of the fastest growing industries, representing a broad swath of the economy. Yet these newly public companies are not evenly distributed across sectors, industries, and business risks. Using Syntax’s Functional Information System (FIS), this report explores the business risk exposure of Initial Public Offerings (IPOs) over the 2019 calendar year to the United States public equity market, analyzing and comparing their distribution across eight sectors of the economy.
Understanding FIS Analysis
Unlike traditional industry classification systems, which offer a one-dimensional, static, taxonomical approach to classification, FIS utilizes a multi-dimensional attribute classification system to better understand underlying risk exposures in investment portfolios. Classifying companies using multiple attributes enables analysis that is more precise, more versatile, and better suited to help investors understand the underlying business risks inherent in their investments.
In analyzing the IPOs of 2019, we considered exclusively U.S.-based companies, which we defined as having the company headquarters, country of incorporation, and primary listing exchange in the United States, as well as ensuring that the company filed either SEC Forms 10-K or S-1. These restrictions excluded some large public offerings such as that of Aramco, the Saudi petroleum company, and American companies launching branches on foreign exchanges, like Budweiser’s debut in Hong Kong. We further omitted “blank-check[1]” holding corporations by requiring the company to report revenue in 2019, although pre-revenue pharmaceutical and biotech companies were included. We believe these restrictions help provide the most accurate picture of American IPOs in 2019.
Healthcare dominates the number of debuting companies; Information takes in largest sector valuation
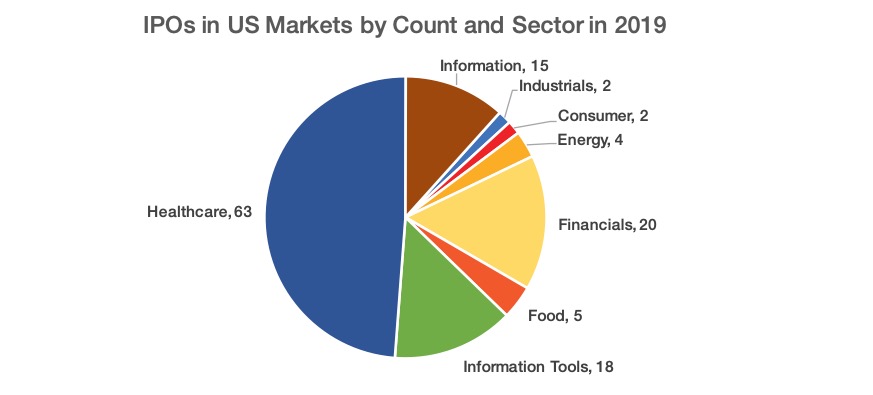
Overall, there were a total of one-hundred-twenty-nine Initial Public Offerings in 2019. By number of IPOs, the Healthcare sector dominated, representing 48.8% of the 2019 IPOs. The next largest sector by number of IPOs, Financials, represented only 15.5%. The concentrations of IPOs in the Healthcare and Financials sectors represent a heavy weighting in certain business risks of new stock into the economy, however it does not tell the full story.
Source: Syntax, FactSet Research Systems.
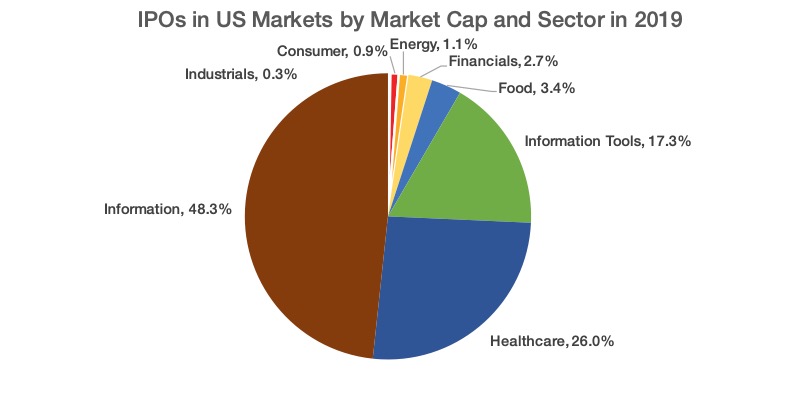
While the Healthcare sector accounted for a significant plurality of IPOs in 2019, the Information sector took in a much greater share of the total market capitalization, with just over $104.9B. That is, 48.8% of the value of newly listed public companies came from the Information sector. This massive amount of funding is made all the more interesting due to the fact that there were only fifteen Information sector IPOs. Source: Syntax, FactSet Research Systems.
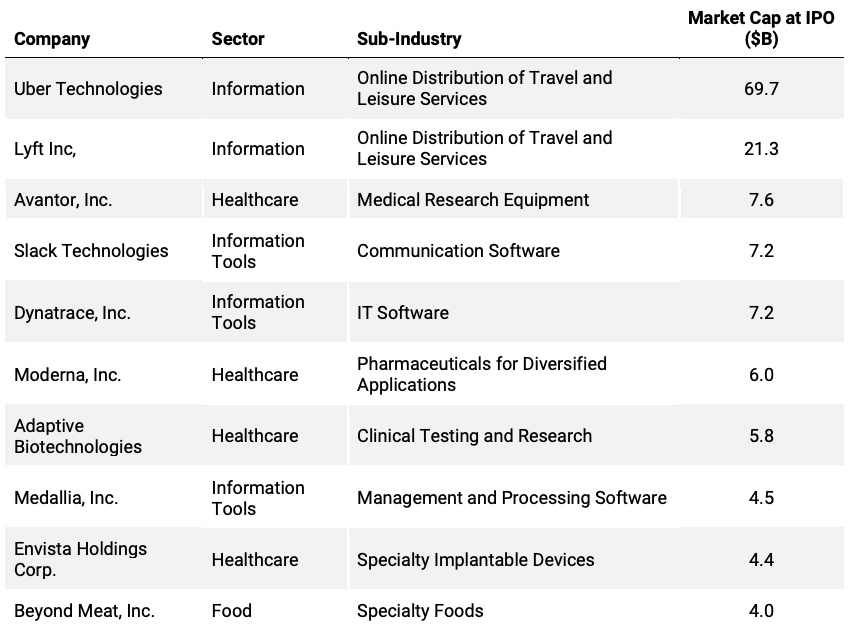
In particular, 2019 was notable for the IPOs of several large, well-hyped consumer-facing tech companies, following trends as the past few years. The largest U.S.-based IPO last year was Uber, the ride-sharing technology company which went public in May. Uber’s primary rival, Lyft, served as the second largest launch last year, when it went public in March. As shown in the chart below, Information, Healthcare, and Information tools dominated the list of the ten largest public offerings by market cap.
Source: Syntax, FactSet Research Systems.
Declines in Consumer Products and Services, Energy and Industrials
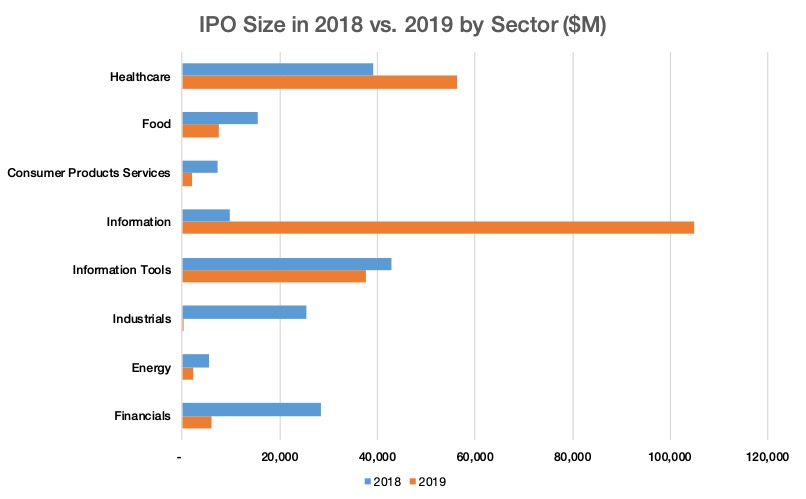
In comparison to the substantial IPOs in Healthcare, Information Tools, and Information, a number of sectors saw declines from 2018 in their IPO size. Consumer Products and Services, Energy, and Industrials all had both fewer companies hold public offerings in 2019 and a smaller collective valuation. Industrials, in particular, saw a steep decline, with its two public offerings representing only $330M in cumulative value, compared to the $25.4B one year earlier. Industrials had the lowest market cap of any sector, followed by Consumer Products and Services at $2.0B. Source: Syntax, FactSet Research Systems.
Sector Breakdown
Healthcare
Sector Definition – The related business risk associated with the Healthcare group is the production of medicine or equipment used in the healthcare industry, or the provision of medical services. Also included in this group are companies engaged in the wholesale of medicine or medical equipment, as well as the provision of health insurance.
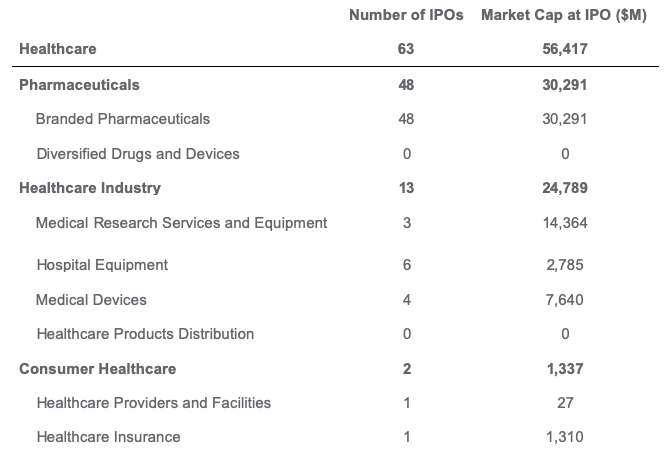
Analysis – Over 2019, the Healthcare sector represented 48.84% (sixty-three companies) of total IPOs in the US public equity market and represents the highest number of additions by a hefty margin. The vast majority of public offerings were in branded pharmaceuticals (forty-eight companies), where nearly all of the IPOs were small, pre-revenue pharmaceutical companies (forty-seven companies). Smaller numbers of commercial-stage pharmaceuticals (one company), research (three companies), medical device manufacturers (four companies), and hospital equipment (six companies) companies were also present, with a notable lack of many new IPOs in consumer-facing healthcare such as hospitals and pharmacies (two companies). While the number of additions was heaviest in branded pharmaceuticals, it is interesting to note that the amount of market capitalization added to the US public market by pharmaceuticals ($30.3 Billion) was very similar to the amount added by the healthcare industry sector ($24.8 Billion), while having less than a third as many companies (thirteen companies). This suggests a more spread out concentration of risk among a higher number of early stage drug companies that are considered less certain to succeed, as opposed to the value found in established Healthcare Industry businesses. Diving deeper, the concentration of market capitalization in the Healthcare Industry was due primarily to Envista Holdings Corp., Adaptive Biotechnologies Corp. and Avantor, Inc.
Source: Syntax, FactSet Research Systems.
Information
Sector Definition – The Information sector covers a significant portion of the new market. Companies in the information sector have a wide range of functions, from media to brokerage services to online platforms and distribution networks. Each of these companies foundationally work with creating and disseminating information.
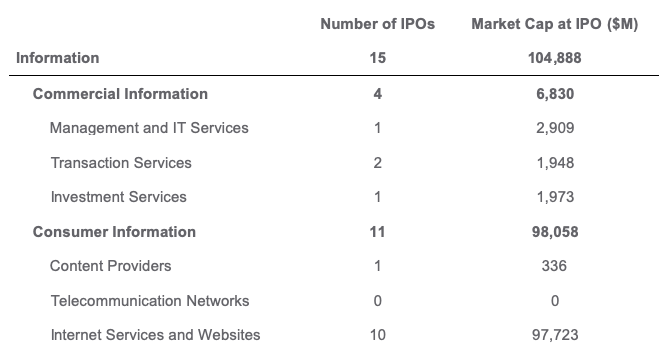
Analysis – The public offerings in the Information sector covered $104.9B in 2019, accounting for 48.8% of the value of newly listed public companies, despite only fifteen IPOs in this sector. 2019 marked an over tenfold increase from Information IPOs in 2018, when only thirteen companies debuted on the market which were cumulatively valued at only $9.6B. The 2019 market cap growth was almost entirely driven by the Online Distribution Networks sub-industry, which accounted for ten of the fifteen companies and $97.7B. Aside from the launches of Uber and Lyft, other significant Online Distribution Network IPOs were TheRealReal, an online luxury consignment store, and Chewy, an online pet supplies company. Source: Syntax, FactSet Research Systems.
Information Tools
Sector Definition – The related business risk associated with the Information Tools group is the development of hardware or software that processes, moves, or stores information. Excluded from this group are providers of information platforms, such as search engines or online marketplaces, as well as licensers of information accessed through software, such as financial databases or educational content.
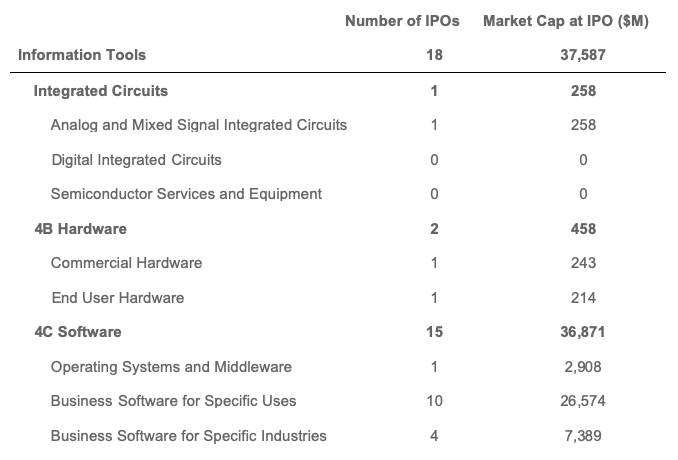
Analysis – Over 2019, the Information Tools sector represented 13.95% (eighteen companies) of total IPOs in the US public equity market. Noticeably, there was a heavy concentration within the Software (fifteen companies) category, of which ten public offerings were Business Software for Specific Uses, like IT, Communication, and Security software. Other Hardware companies (two companies) and an Integrated Circuit company (one company) rounded out the Information Tools sector. In this sector, the number of additions correlated with the largest addition of market cap of fifteen companies and $36.9 Billion. The bulk of market capitalization value was added by Medallia, Inc., Dynatrace Holdings LLC, and the IPO of Slack Technologies, Inc. Source: Syntax, FactSet Research Systems.
Financials
Sector Definition – The Financials risk sector includes a wide range of companies involved in banking, insurance, real estate and other financial products. These companies are involved in banking, insurance, or real estate, and all share similar risks in being industries heavily sensitive to interest rates.
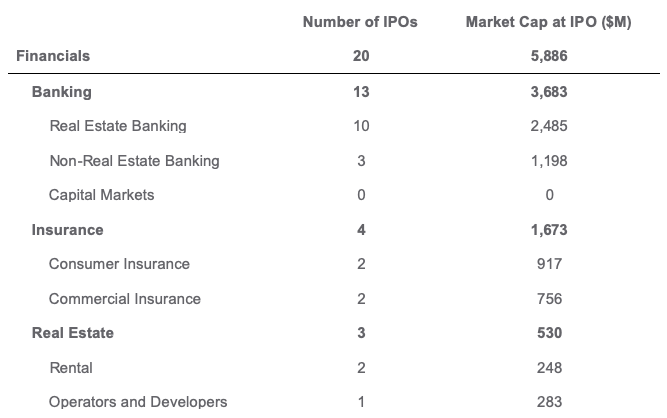
Analysis – In 2019, twenty companies involved in Financials went public, together accounting for $5.9B and 2.7% of all companies who had a public offering. This represents a significant decline from 2018, when twenty-nine Financial companies went public for a collected value of $28.5B. The market capitalization of Financials companies in 2018 was relatively evenly distributed, with Banking, Insurance, and Real Estate sub-sectors each having a greater market cap than the entire 2019 industry. In contrast, the 2019 public offerings were heavily concentrated in Banking, which accounted for $3.7B of the industry’s public offerings. Within the thirteen Banking companies that debuted on the market in 2019, most were regional banks primarily involved in offering consumer and commercial mortgages. Source: Syntax, FactSet Research Systems.
Food
Sector Definition – Companies in the Food sector are involved in economic activities ranging from agriculture to food processing to restaurants, retail, or distribution of food resources.
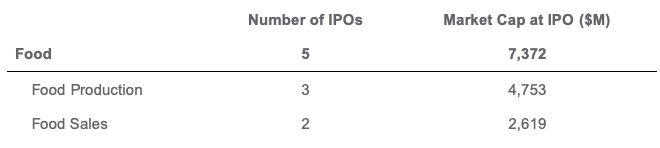
Analysis – In 2019, five Food companies went public, accounting for $7.4B, or 3.4% of the total public offering market capitalization. While the number of companies launching increased from the two that went public in 2018, the total market cap of IPOs in this sector actually saw a sharp decrease from the $15.4B in 2018, due to the launch of Elanco Animal Health, the livestock and veterinary pharmaceuticals company that spun out of Eli Lilly. In contrast, the largest public offering in 2019 was Beyond Meat, the vegetarian specialty food company, which was initially valued at $4.0B. The 2019 IPOs were widely distributed among different sub-industries, with the remaining four IPOs arriving from companies involved in Tobacco Products, Vitamins and Nutritional Supplements, Supermarkets, and Full-Service Restaurants.
Source: Syntax, FactSet Research Systems.
Energy
Sector Definition – The Energy sector captures the related business risk of companies that produce, transport, or sell various energy products, ranging from oil pipelines to natural gas facilities to electric utilities.
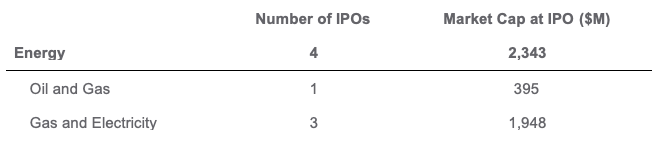
Analysis – In 2019, only four companies in the Energy sector had IPOs, representing just 1.1% ($2.3B) of the market capitalization of the newly public U.S. companies. These numbers are down from 2018, when Energy had seven companies debut with an accumulated market value of $5.5B. Two of the four companies to IPO in 2019 are related to the Midstream Oil and Gas sub-sector, providing oil and gas transportation infrastructure and liquid natural gas facilities, respectively. The other two Energy public offerings occurred in the sub-sectors of Renewable Power Generation and Oil Extraction. Although the total public offering market cap for U.S.-based Energy companies was only $2.34B in 2019, the IPO of Aramco, Saudi Arabia’s national petroleum company, was the world’s largest ever public offering, with the company valued at $1.9 trillion at its entry. Source: Syntax, FactSet Research Systems.
Consumer Products
Sector Definition – The related business risk associated with the Consumer Products and Services group is the manufacture or brick & mortar retail of consumer goods and equipment. This group also includes companies that manufacture and sell consumer automobiles, parts, or provide consumer transportation services. Also included are companies that provide personal consumer services like gyms, beauty salons, and funeral home operators.
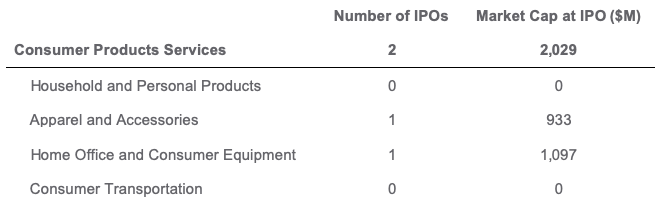
Analysis – Over 2019, the Consumer Products and Services sector (two companies) represented 1.55% of total US public equity market. Compared to other sectors, the Consumer Products and Services had a very small number of IPOs as well as representation of market capitalization (0.93%). The two companies in question were branded apparel manufacturer Levi Strauss & Co., and home gym equipment manufacturer Peloton Interactive, Inc. Especially compared to 2018’s Consumer Products and Services IPOs of nine companies, 2019 was a particularly sparse year for this sector. Source: Syntax, FactSet Research Systems.
Industrials
Sector Definition – The related business risk associated with the Industrials group is the production of raw materials, capital goods, and industrial equipment for commercial use. Also included are companies engaged in transportation, wholesaling, leasing, and other commercial services. The companies included in this bucket are business-to-business. Corresponding companies that receive a majority of their revenue from consumer customers can be found in the Consumer Products group.
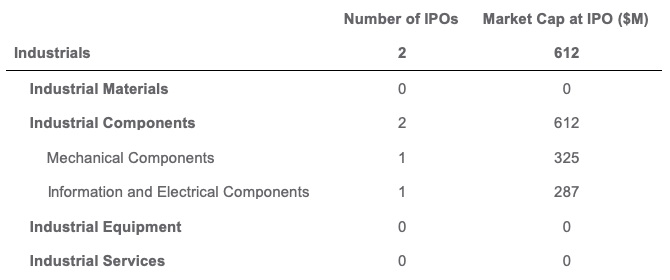
Analysis – Over 2019, the Industrials sector (two companies) represented 1.55% of the total US public equity market. Compared to other sectors, the Industrials had a very small number of IPOs as well as representation of market capitalization (0.28%). The two companies in question were industrial components manufacturer, Mayville Engineering Co., Inc. and solar farm company, SolarMax Technology, Inc. Especially compared to 2018’s Industrials IPOs of ten companies, 2019 was a particularly sparse year for this sector. Source: Syntax, FactSet Research Systems.
[1] A publicly traded, developmental stage company with either no established business plan, or a business plan based around a merger or acquisition with another company or companies.
Disclaimers
This document is for informational purposes only and is not intended to be, nor should it be construed or used as an offer to sell, or a solicitation of any offer to buy, any security. Additionally, the information herein is not intended to provide, and should not be relied upon for, legal advice or investment recommendations. You should make an independent investigation of the matters described herein, including consulting your own advisors on the matters discussed herein. In addition, certain information contained in this factsheet has been obtained from published and non-published sources prepared by other parties, which in certain cases have not been updated through the date hereof. While such information is believed to be reliable for the purpose used in this document, such information has not been independently verified by Syntax and Syntax does not assume any responsibility for the accuracy or completeness of such information. Syntax LLC, its affiliates and their independent providers are not liable for any informational errors, incompleteness, or delays, or for any actions taken in reliance on information contained herein. Charts and graphs are provided for illustrative purposes only.
Syntax® and FIS® are trademarks or registered trademarks of Syntax, LLC and its affiliate Locus LP.