Unprecedented stimulus helps boost asset prices in Q2, but Coronavirus concerns linger
Broad-based recovery in all equity benchmarks following sell-off in Q1 sees diversified indices outperform cap weight in Q2
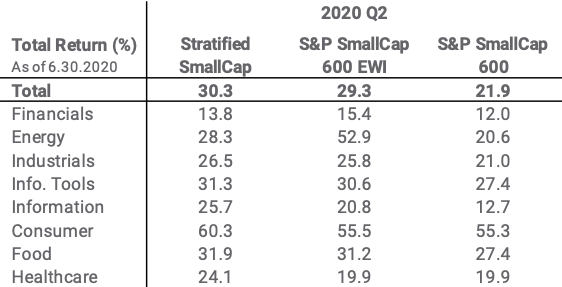
Stratified SmallCap (+30.3%) and MidCap (+27.9%) have strongest quarter on record
Resurgence in COVID-19 cases stalls industry reversals, but value opportunities remain
Economic Breadth Indicator suggests demand for equities is robust
Investor appetite for equities returned in the second quarter as the Fed and the US government vowed to stimulate the economy and return order to financial markets. The Fed was the buyer of last resort for a wide range of corporate debt and increased its balance sheet to 32.6% of GDP by the end of June – more than double the 15.1% of GDP following its measures to stem the Financial Crisis at the end of 2008. Meanwhile employment and consumer confidence were helped by multi-trillion-dollar fiscal programs. The upshot was a dramatic rally in risk assets from lows on the 23rd of March. The S&P 500 had its strongest quarter since 1998 (+20.5%) and the S&P 600 (+21.9%) and S&P 400 (+24.1%) both had their strongest quarter on record.
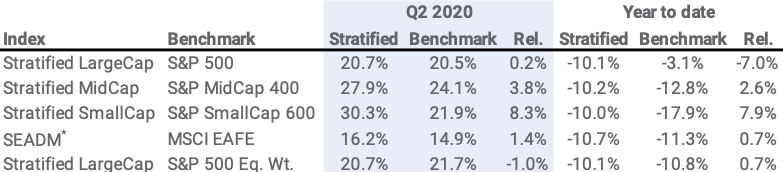
Core Index Comparison: Stratified, Cap, and Equal Weight Source: Syntax, S&P Dow Jones Indices, MSCI. Total return performance does not reflect fees or implementation costs as an investor cannot directly invest in an index. Year-to-date covers period from 1.1.2020 to 6.30.2020. * Syntax Europe & Asia Developed Markets Index, based on the MSCI EAFE universe.
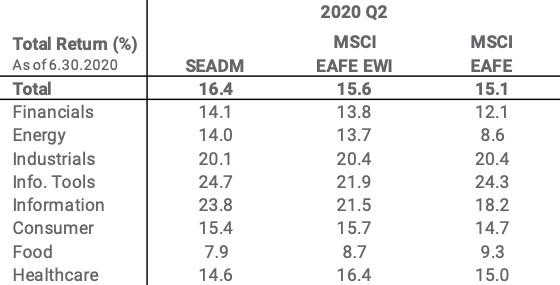
In the face of record quarterly returns, Stratified Weight indices outperformed cap weight in Q2 2020. Marginal outperformance in the LargeCap universe (+0.2%), which was dominated by the continued strong performance of megacap tech stocks, was overshadowed by significantly higher relative returns in the MidCap (+3.8%), SmallCap (+8.3%), and SEADM (1.4%) indices.
Stratified Weight Captures a Higher Small Cap Premium in Q2
The outperformance of smaller stocks in Q2 was motivated by the switch into risk assets on trading days when investors showed less concern regarding the impact of the virus shutdown to smaller businesses. Clearly, after the weakness in Q1, demand for risk premia, especially small caps, is still healthy.
We caution that investors trying to capture the small cap premium often overlook the biases that are inherent to the index and highlight that cap-weighted investments in core small cap products typically carry a different blend of sector exposures than their LargeCap counterparts.
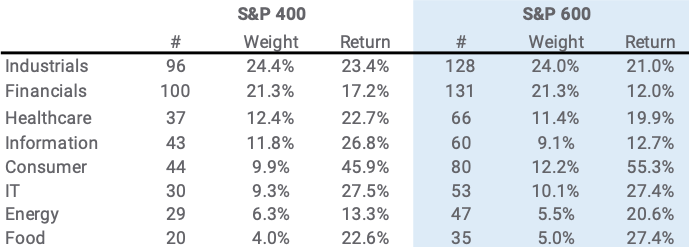
The S&P 400 and S&P 600 indices have remarkably similar sector bets. In both, Industrials and Financials comprise almost half of the index (>45%), by both number of companies and cap weight. Such sector bias challenges whether investors are efficiently capturing the small cap premium. The overweight sectors are not chosen due to an expectation that they will deliver superior performance; rather, the index is overweight these groups largely because they have more listed equities. Sector Weights and Q2 Performance for S&P 400 and 600 (Cap Weight) Source: Syntax, S&P Dow Jones Indices. Number of securities and weight as of 6.30.20; total return calculated from 3.31.2020 – 6.30.2020. Performance does not reflect fees or implementation costs as an investor cannot directly invest in an index. We show in our note “Diversify for the Upside, not just the Downside” that taking concentrated positions without skill usually detracts from performance. The odds of selecting the better performing sectors is outweighed by the odds of selecting poorer performers (due to the skewness of the distribution). This was indeed the case in Q2 2020 when there were 3 sectors with above average returns and 5 with below average. The two largest sector positions in the S&P 600, Industrials and Financials, were in sectors which underperformed the average.
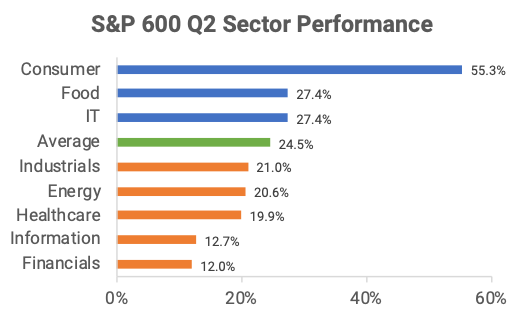
Source: Syntax, FactSet. S&P SmallCap 600 total return, 3.31.20 – 6.30.20, by FIS sector. Performance does not reflect fees or implementation costs as an investor cannot directly invest in an index.
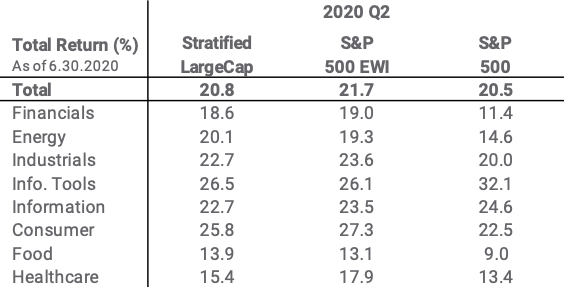
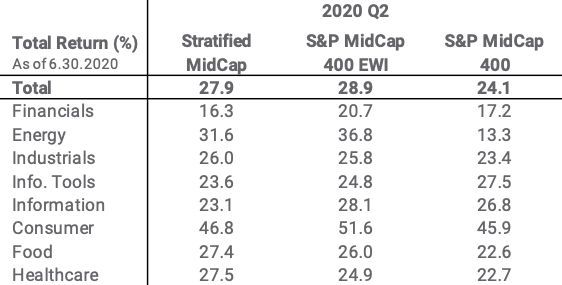
In contrast, the Stratified SmallCap index, which holds the same stocks as the S&P 600, allocated weight equitably across the different sectors and industries. This diversified weighting approach ensures that at the index has at least some exposure to the best performing sectors, which can generate outperformance in environments like Q2.
By avoiding overallocating to Financials, and instead having balanced exposure to Consumer, IT and Food, the Stratified SmallCap and MidCap indices strongly outperformed their cap-weighted benchmarks this quarter.
Reversal stalls as virus lingers. Value opportunities remain
Hopes of a full-fledged reversal for the most virus-sensitive stocks were put on hold as the number of daily confirmed cases of COVID-19 hit new highs in the US and abroad. Though the death rate has not yet seen a commensurate rise, the trend was worrying enough to temper investor enthusiasm for risk assets towards the end of June and into July. As Q2 came to an end, the resurgence served as a headwind for risky assets such as small caps and virus-sensitive industries such as airlines, cruise ships and financials and favored the technology and healthcare sectors.
Volatility during a recovery is not unusual. During the Financial Crisis, it took roughly six months from the collapse of Lehman Brothers (on 15th Sep 2008) for the S&P 500 to trough (on the 10th March 2009). There were multiple false starts during that time as investor optimism came and went regarding the economic impact of the crisis.
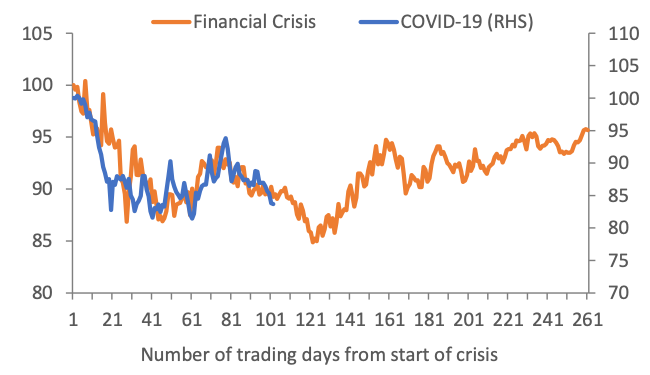
As we wrote in our March report, “Sell-offs, Reversals and Business Risk,” there are many similarities between the COVID-19 sell-off and recovery and the 2008 Financial Crisis. One such similarity is seen by the performance of small caps (S&P 600) relative to large caps (S&P 500).
When investors become more optimistic regarding the economic impact of the virus, the S&P 600 outperforms the S&P 500 (i.e. the lines in the chart below are rising). However, as can be seen by the recent decline in the blue line, as investors become more worried, small caps underperform. S&P 600 relative to S&P 500: Financials Crisis and Coronavirus Pandemic Source: Bloomberg, Syntax. COVID-19 crisis begins 2.21.2020; Financial Crisis begins 9.15.2008. Relative total return performance of the S&P SmallCap 600 vs. S&P 500 does not reflect fees or implementation costs as an investor cannot directly invest in an index.
The current volatility in relative performance is very similar to that seen during the Financial Crisis. When confidence finally returned, the S&P 600 outperformed the S&P 500 by over 12% for the six month period following March 10th, 2009. Though it may take some positive news regarding COVID-19 to drive movement, we note that the valuations for many traditional risk premia (value versus growth or small cap versus large cap) are already at attractive levels.
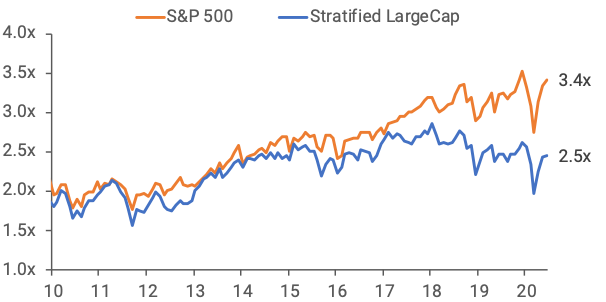
Stratified Weight indices typically carry more Small Cap and Value exposure than cap-weighted indices. As of the end of Q2, the Stratified LargeCap index is trading at a 26% Price / Book discount to the S&P 500 (2.5x vs 3.4x respectively). The two indices had traded in line with one another from 2010 through 2017 and then separated as the cap-weighted benchmark became increasingly overweight in high-multiple technology stocks. Price / Book Ratio: Stratified LargeCap vs S&P 500 Source: Bloomberg, Syntax. Please see important disclaimers regarding backtesting.
Economic Breadth Indicator
The summer lull in activity is a welcome reprieve for equity investors who have been trading at higher frequency than in recent years. The indiscrimant buying in Q2 saw almost every type of company recover from the widespread sell-off in Q1.
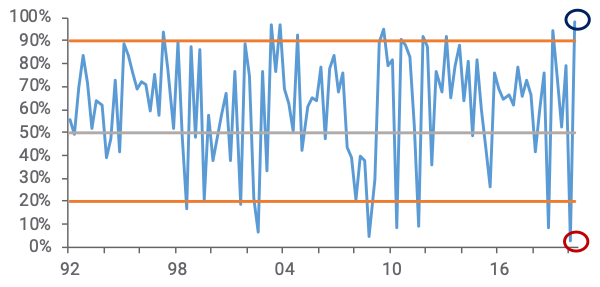
In Q1, everything except Telecom Rental, Security Software, Cloud Access Software and Internet Services companies fell. In Q2, everything recovered, except for two groups: Financial Conglomerates (Berkshire Hathaway and Loews) and Computer Companies (HP and Xerox). In other words, 98% of industries (level 5) had positive returns for the quarter. We say that the Business Breadth was 98% last quarter. Business Breadth for the Stratified LargeCap index Source: Syntax. Breadth is defined as the percent of FIS sub-industries with positive returns for the quarter. Please see important disclaimers regarding backtesting.
We view Business Breadth as confirmation of positive demand for an equity index. When Business Breadth is high, index returns have historically been positive the following quarter.
Stratified LargeCap Index Next Quarter Returns by Business Breadth Decile Source: Syntax. Breadth is defined as the percent of FIS sub-industries with positive returns for the quarter. Please see important disclaimers regarding backtesting.
Since 1992, there were 10 quarters when breadth was above 90%, and the index rose 8 of these 10 times. At the same time, very low levels of Business Breadth (0-20%) is usually a contrarian signal that markets are overly pessimistic, as was the case in Q1 2020. Of course, these empirical observations are naturally anecdotal, though we do believe that they underscore the healthy appetite that investors have for the asset class even in light of the recent volatility.
Sector and Composite Performance
US LargeCap (S&P 500 universe) Source: Syntax. Performance does not reflect fees or implementation costs as an investor cannot directly invest in an index. US MidCap (S&P MidCap 400 universe) Source: Syntax. Performance does not reflect fees or implementation costs as an investor cannot directly invest in an index. US SmallCap (S&P SmallCap 600 universe) Source: Syntax. Performance does not reflect fees or implementation costs as an investor cannot directly invest in an index.
International Developed (MSCI EAFE universe) Source: Syntax. Performance does not reflect fees or implementation costs as an investor cannot directly invest in an index.
Disclaimers
Past performance is no guarantee of future results. All performance presented prior to the index inception date is backtested performance. Backtested performance is not actual performance, but is hypothetical. The inception date of the Syntax Stratified LargeCap and Syntax Stratified MidCap Indices was December 27, 2016. The inception date of the Syntax Stratified SmallCap Index was January 3, 2020. The inception date of the Syntax Europe & Asia Developed Markets (“SEADM”) Index was January 1, 2016. The backtest calculations are based on the same methodology that was in effect when the index was officially launched. However, back-tested data may reflect the application of the index methodology with the benefit of hindsight, and the historic calculations of an index may change from month to month based on revisions to the underlying economic data used in the calculation of the index. Charts and graphs are provided for illustrative purposes only.
The Syntax Stratified LargeCap Index, Syntax Stratified MidCap Index, Syntax Stratified SmallCap Index, SEADM Index are the property of Syntax, LLC, which has contracted with S&P Opco, LLC (a subsidiary of S&P Dow Jones Indices LLC) to calculate and maintain the Indices. The Indices are not sponsored by S&P Dow Jones Indices or its affiliates or its third party licensors (collectively, “S&P Dow Jones Indices”). S&P Dow Jones Indices will not be liable for any errors or omissions in calculating the Index. “Calculated by S&P Dow Jones Indices” and the related stylized mark(s) are service marks of S&P Dow Jones Indices and have been licensed for use by Syntax, LLC. S&P® is a registered trademark of Standard & Poor's Financial Services LLC (“SPFS"), and Dow Jones® is a registered trademark of Dow Jones Trademark Holdings LLC (“Dow Jones”). The MSCI EAFE Index was used by Syntax, LLC as the reference universe for selection of the companies included in the SEADM Index. MSCI does not in any way sponsor, support, promote or endorse the Index. MSCI was not and is not involved in any way in the creation, calculation, maintenance or review of the Index. The MSCI EAFE Index was provided on an “as is” basis. MSCI, each of its affiliates and each other person involved in or related to compiling, computing or creating the MSCI EAFE Index (collectively, the “MSCI Parties”) expressly disclaim all warranties (including, without limitation, any warranties of originality, accuracy, completeness, timeliness, non‐infringement, merchantability and fitness for a particular purpose). Without limiting any of the foregoing, in no event shall any of the MSCI Parties have any liability for any direct, indirect, special, incidental, punitive, consequential (including, without limitation, lost profits) or any other damages in connection with the MSCI EAFE Index or the SEADM Index. Prior to March 19, 2018, the SEADM Index was calculate by NYSE. Sector subsets of the Syntax Stratified LargeCap, Syntax Stratified MidCap, and SEADM Indices are calculated using model performance generated in FactSet, and as such may differ from index calculations performed by S&P Dow Jones Indices. Syntax®, Stratified®, Stratified Indices®, Stratified-Weight™, Stratified Benchmark Indices™, Stratified Sector Indices™, Stratified Thematic Indices™, and Locus® are trademarks or registered trademarks of Syntax, LLC and its affiliate Locus LP. FactSet® is a registered trademark of FactSet Research Systems, Inc.
Index performance does not represent actual fund or portfolio performance and such performance does not reflect the actual investment experience of any investor. An investor cannot invest directly in an index. In addition, the results actual investors might have achieved would have differed from those shown because of differences in the timing, amounts of their investments, and fees and expenses associated with an investment in a portfolio invested in accordance with an index. None of the Syntax Indices or the benchmark indices portrayed herein charge management fees or incur brokerage expenses, and no such fees or expenses were deducted from the performance shown; provided, however that the returns of any investment portfolio invested in accordance with such indices would be net of such fees and expenses. Additionally, none of such indices lend securities, and no revenues from securities lending were added to the performance shown.
The S&P 500® Index is an unmanaged index considered representative of the US mid- and large-cap stock market. The MSCI EAFE Index is an unmanaged index considered representative of the European, Australian, and East Asian large-cap stock market. Benchmark data for the S&P 500, S&P MidCap 400, and S&P SmallCap 600 Indices are provided by S&P Dow Jones through FactSet®. Benchmark data for the MSCI EAFE index is provided by MSCI through FactSet.
This document is for informational purposes only and is not intended to be, nor should it be construed or used as an offer to sell, or a solicitation of any offer to buy, any security. Additionally, the information herein is not intended to provide, and should not be relied upon for, legal advice or investment recommendations. You should make an independent investigation of the matters described herein, including consulting your own advisors on the matters discussed herein. In addition, certain information contained in this factsheet has been obtained from published and non-published sources prepared by other parties, which in certain cases have not been updated through the date hereof. While such information is believed to be reliable for the purpose used in this factsheet, such information has not been independently verified by Syntax and Syntax does not assume any responsibility for the accuracy or completeness of such information. Syntax LLC, its affiliates and their independent providers are not liable for any informational errors, incompleteness, or delays, or for any actions taken in reliance on information contained herein.