S&P 500 has worst performance day versus Stratified Weight
As the number of Coronavirus infections continues to make new highs, equity markets have instead focused on the positive news regarding the three largest vaccination trials.
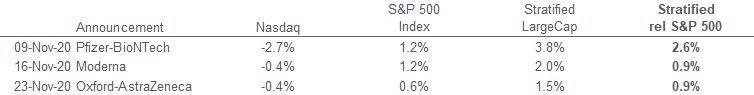
On November 9th, Pfizer announced that their vaccine produced in collaboration with BioNTech reduces infections in 90% of cases. The S&P 500 rose 1.2% on the day but suffered from a rotation away from large cap technology stocks. Alternative weighted strategies outperformed significantly, with the Syntax Stratified LargeCap index rising 3.8% for its strongest relative performance ever recorded (+2.6%, see Exhibit 1 below).
Moderna and AstraZeneca followed suit by releasing the results of their studies showing comparable, if not marginally improved efficacy. The market digested the news in similar fashion and the reversal of travel and oil related companies continued.
As the market continues to discount an end to the pandemic, we look at the recent trends in the context of their component themes to determine the drivers of the performance and whether there is capacity for the reversal to persist.
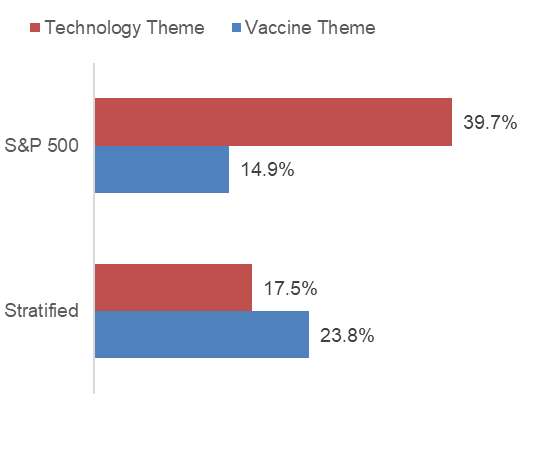
We find that the majority of the performance of cap versus alternative weight is driven by the relative exposure to three vaccine beneficiaries: Tourism, Corporate Real Estate and Oil at the expense of Technology. According to Affinity, the S&P 500 has 14.9% in vaccine beneficiary themes vs 23.8% for Stratified weight and 40% in Technology stocks which underperform following positive vaccine news, versus 17.5% for Stratified weight.
Exhibit 1: Index performance on Vaccine news daysPerformance does not reflect fees or implementation costs as an investor cannot directly invest in an index. Source: S&P Dow Jones Indices, Syntax
Cap-weight correlated with the virus since pandemic began
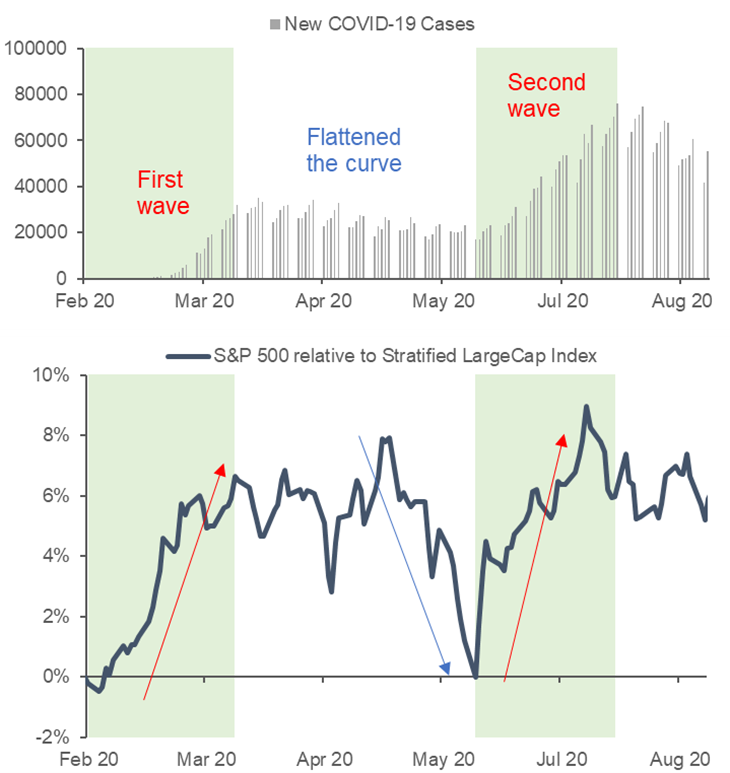
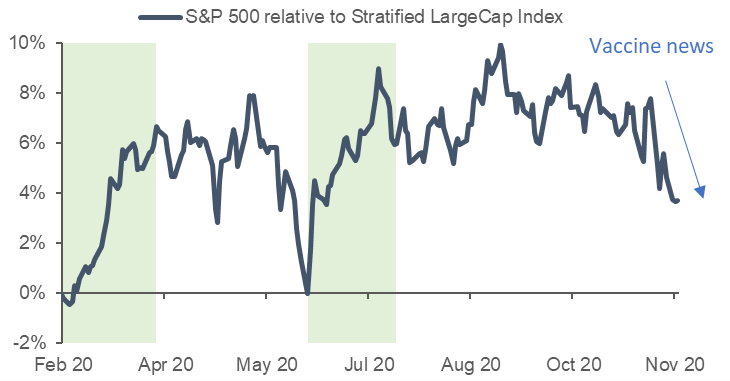
The recent relative performance of cap-weighted indices versus their alternative weighted counterparts will not come as a surprise. Since the market became focused on the pandemic on Feb 20th, the performance of the S&P 500 versus alternative weight products has been correlated with the trend in new infections. As cases grew in the US, alternative weight indices which are underweight mega-cap technology stocks underperformed the cap-weighted benchmark by 6.5%. However, as cases dissipated in May, investors moved back into value stocks and the S&P 500 gave back all its relative outperformance over Stratified weight (Exhibit 2).
This recovery was short-lived and as the virus lingered and a second wave of cases spread into the rest of the country, investors moved back into technology companies and cap-weighted products once again outperformed.
Exhibit 2: Coronavirus cases and the S&P 500 relative to the Stratified LargeCap index Performance does not reflect fees or implementation costs as an investor cannot directly invest in an index. Source: CDC, S&P Dow Jones Indices, Syntax
Vaccine Themes
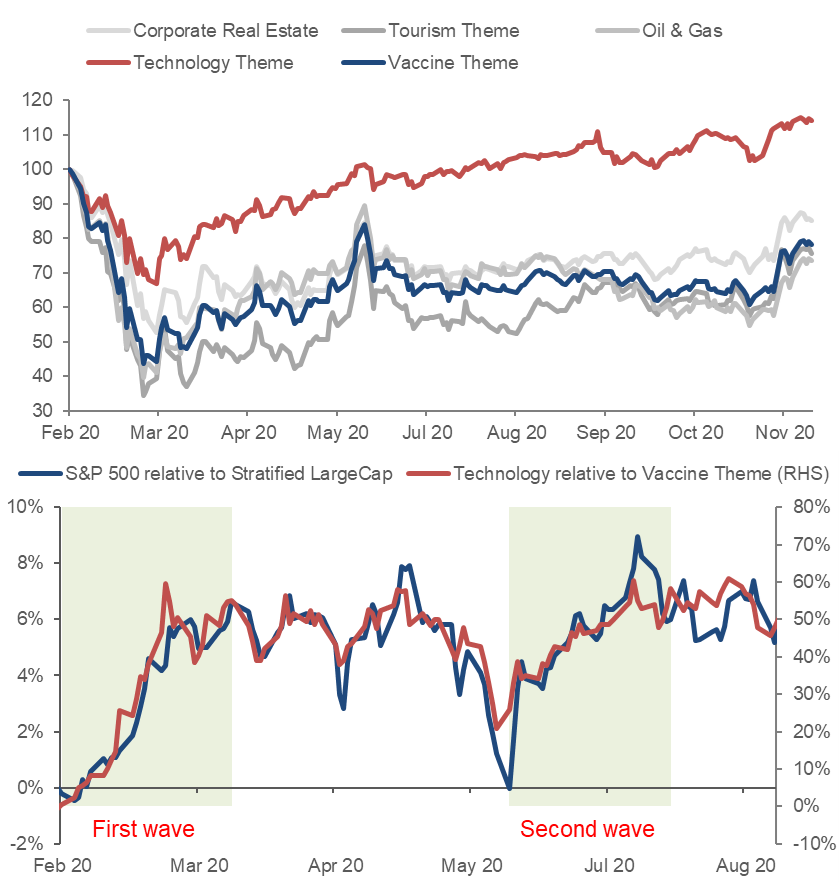
Using Affinity™ we measure the performance of groups of stocks in the S&P 500 through a variety of different lenses and isolate four themes that are linked to the Coronavirus pandemic (i.e. diverged during the first and second infection waves).
The results are very intuitive. The Affinity Technology theme consistently outperformed during the first and second waves and the Tourism and Corporate Real Estate thematics, together with Oil & Gas (i.e. Vaccine themes) outperformed when cases fell in May and it looked as though the virus was under control.
The relative performance of these themes explained 85% of the relative outperformance of cap versus stratified weight (in Exhibit 3). This is due in part to the significantly different exposures that the Stratified weight and cap weight have to these themes (Exhibit 4).
Exhibit 3: Performance of COVID-19 sensitive themes
Performance does not reflect fees or implementation costs as an investor cannot directly invest in an index. Please see important disclaimers regarding backtested data prior to inception. Source: S&P Dow Jones Indices, Syntax Exhibit 4: S&P 500 vs Stratified LargeCap Index Exposure Source: Affinity
And if it was all a bad dream?
Using Feb 20th as an anchor date for a pre-COVID market, we find that the S&P 500 would underperform the Stratified LargeCap by 3% for the two indices to return to the same levels (Exhibit 5).
Exhibit 5: S&P 500 relative to Stratified LargeCap index since 2/20/20 Performance does not reflect fees or implementation costs as an investor cannot directly invest in an index. Source: Syntax
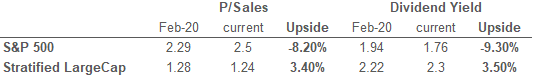
We also see a strong fundamental reason for the Stratified LargeCap index to outperform the S&P 500. Using each index’s valuation multiples on 2/20/20 as target levels, we find that the S&P 500 is 8-9% overvalued and the Stratified LargeCap index is 3.5% undervalued (Exhibit 6).
Exhibit 6: Upside potential if multiples return to 2/20/20 levels We use two transparent valuation metrics P/Sales and Dividend Yield, rather than earnings or cash flow-based metrics which are more opaque and volatile. Source: Syntax, Bloomberg Estimates (BEst)
There are of course many reasons why prices and valuations should not revert to pre-crisis levels, such as the secular change to peoples’ working habits that the pandemic merely accelerated.
However, such views are open to debate and with pent-up demand for companies aligned with the vaccine themes, we believe there is plenty of scope for these trends to continue.
Important Disclaimers
Past performance is no guarantee of future results. All performance presented prior to the index inception date is backtested performance. Backtested performance is not actual performance, but is hypothetical. The inception date of the Syntax Stratified LargeCap Index was December 27, 2016. The backtest calculations are based on the same methodology that was in effect when the index was officially launched. However, back-tested data may reflect the application of the index methodology with the benefit of hindsight, and the historic calculations of an index may change from month to month based on revisions to the underlying economic data used in the calculation of the index. Charts and graphs are provided for illustrative purposes only.
The Syntax Stratified LargeCap Index (“the Index”) is the property of Locus Analytics, LLC, which has contracted with S&P Opco, LLC (a subsidiary of S&P Dow Jones Indices LLC) to calculate and maintain the Index. The Index is not sponsored by S&P Dow Jones Indices or its affiliates or its third party licensors (collectively, “S&P Dow Jones Indices”). S&P Dow Jones Indices will not be liable for any errors or omissions in calculating the Index. “Calculated by S&P Dow Jones Indices” and the related stylized mark(s) are service marks of S&P Dow Jones Indices and have been licensed for use by Locus Analytics, LLC. S&P® is a registered trademark of Standard & Poor's Financial Services LLC (“SPFS"), and Dow Jones® is a registered trademark of Dow Jones Trademark Holdings LLC (“Dow Jones”). Syntax®, Stratified®, Stratified Indices®, Stratified WeightTM, and Locus® are trademarks or registered trademarks of Syntax, LLC or its affiliate Locus, LP.
Index performance does not represent actual fund or portfolio performance and such performance does not reflect the actual investment experience of any investor. An investor cannot invest directly in an index. In addition, the results actual investors might have achieved would have differed from those shown because of differences in the timing, amounts of their investments, and fees and expenses associated with an investment in a portfolio invested in accordance with an index. None of the Syntax Indices or the benchmark indices portrayed herein charge management fees or incur brokerage expenses, and no such fees or expenses were deducted from the performance shown; provided, however that the returns of any investment portfolio invested in accordance with such indices would be net of such fees and expenses. Additionally, none of such indices lend securities, and no revenues from securities lending were added to the performance shown.
This presentation is for informational purposes only and is not intended to be, nor should it be construed or used as an offer to sell, or a solicitation of any offer to buy, any security. Additionally, the information herein is not intended to provide, and should not be relied upon for, legal advice or investment recommendations. You should make an independent investigation of the matters described herein, including consulting your own advisors on the matters discussed herein. In addition, certain information contained in this factsheet has been obtained from published and non-published sources prepared by other parties, which in certain cases have not been updated through the date hereof. While such information is believed to be reliable for the purpose used in this factsheet, such information has not been independently verified by Syntax and Syntax does not assume any responsibility for the accuracy or completeness of such information. Syntax LLC, its affiliates and their independent providers are not liable for any informational errors, incompleteness, or delays, or for any actions taken in reliance on information contained herein.
Certain information contained in this report is non-public, proprietary and highly confidential and is being submitted to selected recipients only. Accordingly, by accepting and using this report, you will be deemed to agree not to disclose any information contained herein except as may be required by law. This factsheet and the information herein may not be reproduced (in whole or in part), distributed or transmitted to any other person without the prior written consent of Syntax. Distribution of Syntax data and the use of Syntax indices to create financial products requires a license with Syntax and/or its licensors. Investments are not FDIC insured, may lose value and have no bank guarantee.